MP Board Class 9th Social Science Solutions Chapter 8 Map: Reading and Numbering
MP Board Class 9th Social Science Chapter 8 Text Book Questions
Choose the Correct Answer:
Question 1.
Which element is related in proportion to distance in a map?
(a) Scale
(b) Use of color
(c) Grid of Latitudes and Longitudes
(d) Use of conventional signs
Answer:
(a) Scale
Question 2.
Which is not a type of map?
(a) Physical map of Kerala
(b) Political map
(c) Sketch map of India
(d) Distribution map
Answer:
(c) Sketch map of India
Question 3.
Which scale is a Representative Fraction (R.F.)?
(a) One inch is equal to ten miles
(b) 1 cm = 1 km
(c) One cm for ten km.
(d) 1:10,000
Answer:
(b) 1 cm = 1 km
Question 4.
Conventional signs are certified by
(a) Central Information Department
(b) Indian Constitution
(c) Survey Department
(d) Parliament of India.
Answer:
(c) Survey Department
Match the following:
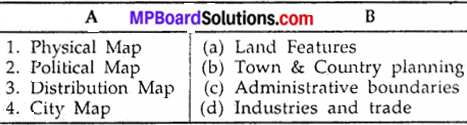
Answer:
1. (d) Industries and trade
2. (c) Administrative boundaries
3. (a) Land Features
4. (b) Town & Country planning
![]()
MP Board Class 9th Social Science Chapter 8 Very Short Answer Type Questions
Question 1.
What is a map?
Answer:
A map is a representation of selected features of the whole earth or a part of it on a plane surface, with conventional signs, drawn to a scale and projection so that each and every point corresponds to the actual terrestrial position.
Question 2.
Write the important elements of a map.
Answer:
The important elements of a map are:
- Direction
- Title and sub-title
- Conventional signs.
Question 3.
Name different types of scale.
Answer:
- Statement scale
- Linear scale.
Question 4.
What is represented by a physical map?
Answer:
A physical map shows the physical features of the region, for example, hills, mountains, rivers, plain, plateaus etc.
MP Board Class 9th Social Science Chapter 8 Short Answer Type Questions
Question 1.
Differentiate between a sketch map and a map.
Answer:
There are certain points which are necessary in a geographical map called elements of a map. Without these elements (direction, title and sub – title and conventional signs) a map is incomplete and we call it a Sketch map. A map possesses all these elements.
Question 2.
What is the importance of scale in a map?
Answer:
map cannot be drawn without a scale. It is not possible to. draw a map of the whole earth surface on a paper because finding a huge paper is difficult. To draw a suitable map we use scale, according to which some topographic features are drawn on a plane paper in a map. There is a ratio between the distance of two points on a map and the distance between the corresponding points on the actual ground. This ratio is known as scale.
![]()
Question 3.
What is Representative Fraction?
Answer:
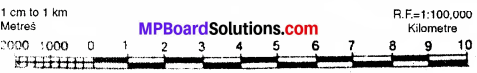
Scale of a map may also be indicated by a fraction called the Representative Fraction (R,F.) in which numerator is 1. The numerator represents the distance on the map while the denominator indicates the actual distances on the ground.
![]()
For example, the R.F. of a map indicates as 1/1,000,000 or 1 : 100,000. This means one unit of distance on the map is equal to 1,00,000 units on the ground. The unit may be measure of length. Thus the R.F. is independent of any particular unit of measurement. If the R.F. of map is 1:100,000 it means that the scale of a map is 1 cm to 100,000 cm or 1 km.
Question 4.
Explain statement scale.
Answer:
Scale presented in the form of a statement like 1 cm to 10 km. is called statement scale. This scale shows that 1 cm represents a distance of 10 km. on the ground.
Question 5.
What is the utility of interpretation of a map?
Answer:
We can collect sufficient information of an area from its map by interpretation. We can know about the physical features present in the area depicted in the map. For example, water bodies, hills etc. We can also know about the means of transport – like rail routes, air-routes, roads etc. that join the given area with other places.
Question 6.
What are contour lines?
Answer:
1. Contour Lines. They are imaginary lines drawn on a map. They join places having the same elevation or height above the sea level. These lines are best suited to depict the relief feature – the delineation of hills and plains and distinguishing of high grounds and low grounds.
If so many contour lines are drawn, say showing areas with heights of 400, 600, 800, 1000 feet above sea level, then it is possible to know the shape of the land. But the contour lines have some defects also. They give the height above the sea-level but not the actual height. Moreover, they do not help us in determining certain other features of the geographical data. In this regard their scope is limited.
MP Board Class 9th Social Science Chapter 8 Long Answer Type Questions
Question 1.
How many types of maps are there on the basis of utility?
Answer:
Maps drawn on the basis of utility may be classified into four parts:
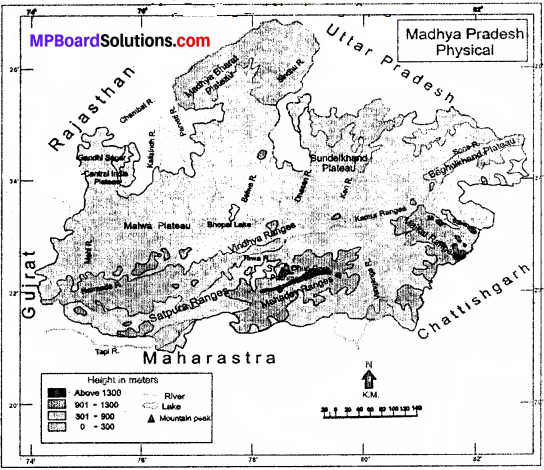
1. Physical Map:
On these maps relief features like mountains, plateau, plains, valleys etc. are shown by different colors as brown, yellow and green according to contour lines. As mountainous regions are shown with dark brown color in the given map of Madhya Pradesh.
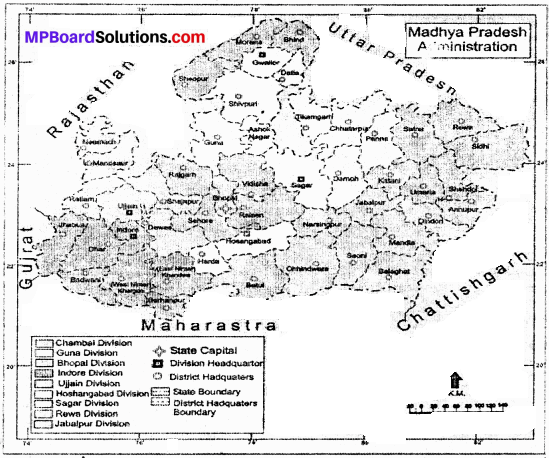
2. Political Map:
These maps show different countries, their administrative units, capitals, cities, transportation routes etc. Physical and cultural features are also sometimes seen in the background. In the map (Madhya Pradesh : Administration) given in the right side you can see the location of different districts of Madhya Pradesh, their headquarters and the neighboring states of M.P.
3. Distribution Map:
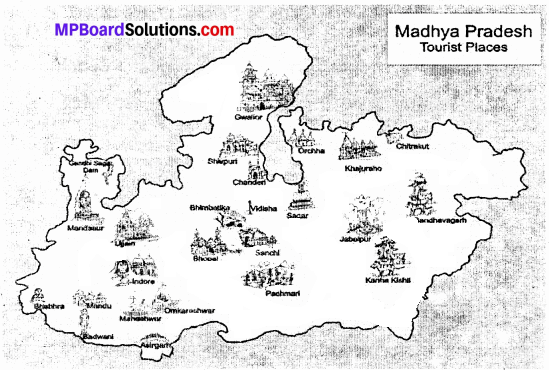
These maps display the distribution of elements found on the Earth, Continent, Country or on any part of the country. Distribution of rainfall, temperature, pressure, crop production, minerals, flora, fauna, industries, trade, means of transport, population and tourist places etc. are shown on these maps. In the map (Madhya Pradesh : Tourist Places) you can locate the tourist places of Madhya Pradesh.
4. Special Maps:
These maps are drawn for some special purpose and are used for specific information. This includes many types of maps as – Relief Map, Geological Map, City Planning Map, Weather Map, Ocean Route and Air Route Map, Military Map, etc.
Question 2.
What are maps? Write the importance of maps.
Answer:
A map is a representation of selected features of the whole earth or a part of it on a plane surface, with conventional signs, drawn to a scale and projection so that each and every point corresponds to the actual terrestrial position.
Importance of Maps:
Importance of maps is increasing in recent times because of the following reasons:
- Any part of the earth surface can be studied with the help of a map.
- It is a technique of representing a fact in an interesting manner and in brief.
- Map is a language of social science which can be under¬stood in every country.
- A lot of information is provided by the maps in short period of time.
- Map is an authentic document to solve the boundary dispute between two adjacent countries.
- Topographical maps are used in regional planning.
- Maps help in the economic development of a region by showing the location of the available resources on the map.
- Maps are useful for State Reorganization Commission when the boundary of the new state, district or tensile is marked.
- Topographical maps are most important for military purposes. At the time of war maps are useful for soldiers.
- Maps are very useful in Tourism Industry showing tourist places and routes.
- Maps are also useful in other sciences like Climatology, Oceanography, Botany, Political Science, History, Geology etc.
![]()
Question 3.
Explain numbering of maps.
Answer:
The maps of our country are made by National Survey of India. Its head office is in Dehradoon (Uttaranchal). Numbering on map is very essential and useful.
Question 4.
Explain the types of maps on the basis of utility.
Answer:
Maps drawn on the basis of utility may be classified into four parts:
1. Physical Map:
On these maps relief features like mountains, plateau, plains, valleys etc. are shown by different colors as brown, yellow and green according to contour lines. As mountainous regions are shown with dark brown color in the given map of Madhya Pradesh.

2. Political Map:
These maps show different countries, their administrative units, capitals, cities, transportation routes etc. Physical and cultural features are also sometimes seen in the background. In the map (Madhya Pradesh : Administration) given in the right side you can see the location of different districts of Madhya Pradesh, their headquarters and the neighboring states of M.P.

3. Distribution Map:
These maps display the distribution of elements found on the Earth, Continent, Country or on any part of the country. Distribution of rainfall, temperature, pressure, crop production, minerals, flora, fauna, industries, trade, means of trans¬port, population and tourist places etc. are shown on these maps. In the map (Madhya Pradesh : Tourist Places) you can locate the tourist places of Madhya Pradesh.

4. Special Maps:
These maps are drawn for some special purpose and are used for specif information. This includes many types of maps as – Relief Map, Geological Map, City Planning Map, Weather Map, Ocean Route and Air Route Map, Military Map, etc.
Questions Related To Development Of Skills
Question 1.
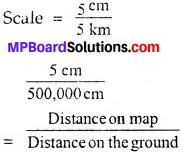
If the distance between two places is 5 cm and the actual distance between the same places on the ground is 5 km. Then what would be the scale?
Answer:
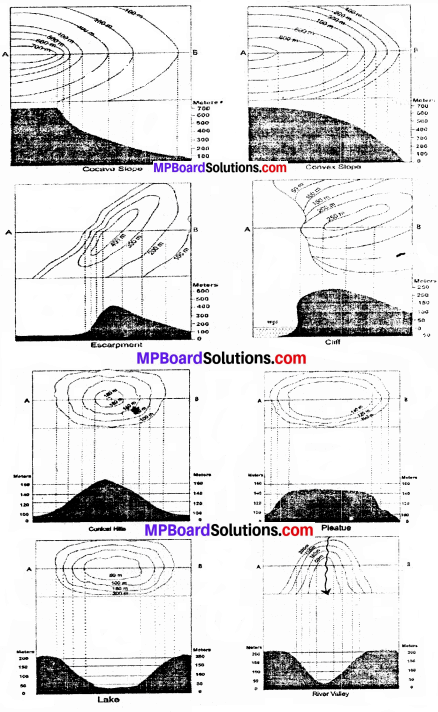
Question 2.
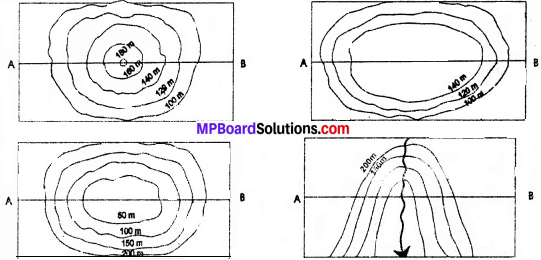
Identify and name the relief features in the given contour maps.
Answer:
(a) Conical hills
(b) Plateau
(c) Lake
(d) River Valley
MP Board Class 9th Social Science Chapter 8 Other Important Questions
Choose the correct answer:
Question 1.
(i) Usually low lands are indicated by shades of –
(a) Brown
(b) Yellow
(c) Green
(d) Grey
Answer:
(c) Green
Question 2.
Heights are indicated in –
(a) Meters
(b) Feet
(c) Meters or feet
(d) Inches.
Answer:
(c) Meters or feet
Question 3.
The head office of National Survey of India is in –
(a) Dehradoon
(b) Nainital
(c) Delhi
(d) Gwalior
Answer:
(a) Dehradoon
Question 4.
On the basis of utility maps are classified into –
(a) Five parts
(b) Four parts
(c) Three parts
(d) Nine parts.
Answer:
(b) Four parts
Question 5.
Which one is not a land form?
(a) Mountains
(b) Plateau
(c) Plains
(d) Wall
Answer:
(d) Wall
Match the following:
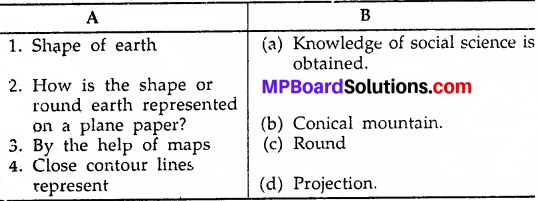
Answer:
1. (c) Round
2. (d) Projection
3. (a) Knowledge of social science is obtained.
4. (b) Conical mountain.
![]()
MP Board Class 9th Social Science Chapter 8 Very Short Answer Type Questions
Question 1.
Where can we see maps?
Answer:
We can see maps in the books, atlases and on the walls.
Question 2.
What is map projection?
Answer:
Map projection is a systematic drawing of parallels of latitudes and meridians of longitude (graticule) on a plane paper or cloth for the whole earth or a part of it on a certain scale.
Question 3.
What are conventional signs?
Answer:
There are certain standard signs and symbols to represent the topographical features (mountains, plateau, rivers, etc.) on the map known as conventional signs.
Question 4.
What does a political map show?
Answer:
A political map shows different countries, their administrative units, capitals, cities, transportation routes etc.
Question 5.
What is known as Representation of Relief Features?
Answer:
The three dimensional presentation of various relief features is known as Representation of Relief Features.
![]()
Question 6.
What is Datun Plane?
Answer:
The height of the contour lines is measured from the mean sea level. This level is known as Datun Plane.
Question 7.
How are higher elevations represented?
Answer:
Higher elevations are represented by shades of yellow, brown, red and violet.
Question 8.
If contour lines are-closer, what does it indicate?
Answer:
If contour lines are closer it indicates a steep slope.
Question 9.
If contour lines are widely spaced, what does it indicate?
Answer:
If contour lines are widely spaced it indicates gentle slope.
Question 10.
What are known as topographical sheets?
Answer:
The maps in which the relief and other features are represented by conventional signs and symbols are known as topographical sheets.
![]()
MP Board Class 9th Social Science Chapter 8 Short Answer Type Questions
Question 1.
What is the importance of a scale’?
Answer:
Scale is the most important item in the study of maps:
- With the help of scale, we can represent large areas in a reduced shape and size.
- Without a scale, a map is simply a diagram or sketch. A , map is meaningless without scale.
- We can measure the distance between two paints on the map without going to the field.
- A map can be reduced or enlarged with the help of a scale.
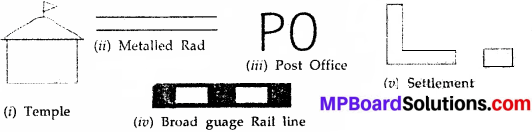
Question 2.
What do you mean by conventional signs? Show the following by conventional signs.
- Temple,
- Metalled road,
- Post Office
- Broad guage rail line
- Settlement
Answer:
The topographical features like mountains, plateau, plains, rivers, and man – made structures like settlements, railway path, roads etc. are shown with the help of pictures in the map. They are called conventional signs.
Question 3.
Write short note on ’Layer co-louring’
Answer:
This is a very common method of showing distribution of relief over a wide area. Atlases and wall maps follow this method almost universally. The color scheme adopted in showing the relief or elevation is almost uniformly followed everywhere. The sea is colored blue. Usually deep blue indicated deep sea and light blue stands for shallow sea. Low lying areas are shown in deep f green and as the land rises in elevation, light green, light brown, dark brown, crimson red and white are used in the ascending order.
Question 4.
What are distribution maps? Name its types. Give examples.
Answer:
Distribution maps show the distribution of an element in the form of value, intensity or density. These are of two types – Qualitative and Quantitative. Vegetation maps and Soils maps are Qualitative maps, whereas population maps are Quantitative maps. Population distribution is shown with the help of dots. Each dot represents a specific number of persons.
![]()
Question 5.
Explain clearly the difference between the contour pat-terns of a conical hill, a plateau, a ridge and a valley.
Answer:
- Conical Hill – Contours are concentric circles drawn at uniform interval.
- Plateau – The top of left flat without contours; on the sides, contours are closed.
- Ridge – Contours are elongated circles.
- Valley – Contours are inverted V’ shaped.
MP Board Class 9th Social Science Chapter 8 Long Answer Type Questions
Question 1.
In what ways is the scale represented on a map?
Answer:
There are different methods of representing scale on a map.
1. By a Statement:
The scale, in this method is expressed by a statement. This means that the scale is stated in words such as 1 centimeter to 1 kilometer. This scale would be interpreted as one centimeter on the map corresponds to one kilometer on the surface of the earth. The reason is that this indication of scale would be understood by only those who are familiar with particular unit of measurement.
2. By a Representative Fraction (R.F.):
Scale of a map may also be indicated by a fraction called the Representative Fraction – (R.F.) in which numerator is 1. The numerator represents the distance on the map while the denominator indicated the actual distance on the ground.
![]()
For example, the R.F. of a map indicates as 1/1,00,000 or 1 : 100,000. This means one unit of distance on the map is equal to 100,000 units on the ground. Hie unit may be measured of length. Thus the R.F. is independent of any particular unit of measurement. If the R.F. of map is 1 : 100,000 it means that the scale of a map is 1 cm to 100,000 cm or 1 km.

3. By Linear Scale:
The linear scale is a line conveniently divided and sub-divided so that the distance on the map can be directly measured and read out from the map in term of distances on the ground in kilometers. Linear scales are used to measure actual distances between different places on the map.
![]()
Question 2.
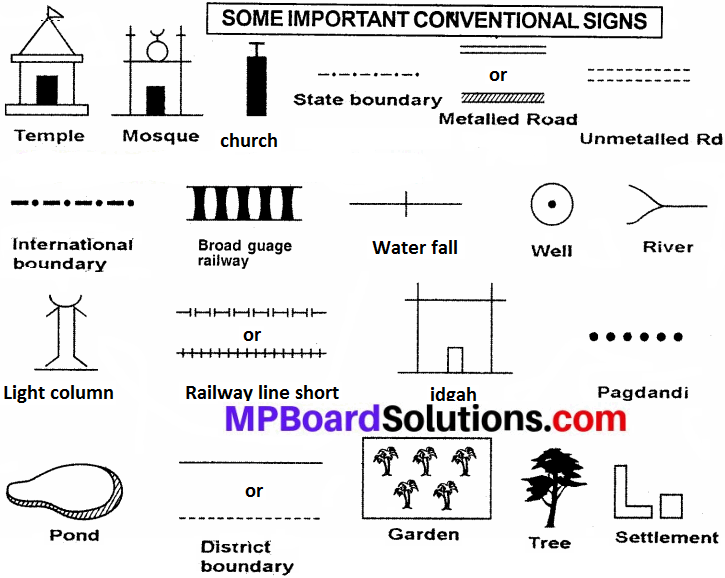
What are conventional signs? Draw some important conventional signs.
Answer:
Conventional Symbols (Signs) of towns, villages, buildings, railway lines, roads, trees etc. are big features. It is extremely difficult to draw on a map the actual shape and size of these features. Therefore, we use various symbols to show them on the map. All the countries use the same symbol for a particular feature.
These symbols are recognized all the world over and are called Conventional Symbols or Conventional Signs. These symbols are very useful in understanding the features of the lands shown on the map. Roads, towns, buildings, etc. are shown in red color. Black lines show railways. Rivers, canals, tanks, lakes and other water bodies are shown is blue color.
Question 3.
Write in detail on ‘Representation of Relief Features.’
Answer:
The surface of the earth is not same everywhere. It has various land forms like mountains, plateau, plains, rivers, valleys etc. The three – dimensional presentation of various relief features is known as Representation-of Relief Features. The height or a depth of a place is measured from the sea level. The imaginary lines joining places having the same elevation above or below the sea level are called contour lines and measured from the mean sea level.
This level is known as Datum Plane. The height at this plane is considered as zero and with reference to this base line the height of the place is measured. In small scale maps like wall maps and atlas maps, relief features are indicated by a scheme of graded colors. Each latitudinal zone is indicated by a particular color. Usually low lands are indicated by shades of green. Higher elevations are represented by shades of yellow, brown, red and violet.
Snow capped peaks are shown as white or left uncolored. Heights are indicated in meters or feet. Depth of the.sea is shown by varying shades of blue. Darker shades indicate greater depth in the Ocean. Means the highest part (mountains) or the deepest part (Oceans) should be indicated by the darker shades and less deeper parts is represented by lighter shades. In this way relief features like mountains, plateau and plains are represented.
On large scale maps, like topographic maps relief features are shown by contour lines. In the maps places of same height above sea level are shown by contour lines. Contour lines are based on a detailed survey of heights of several places in an area. The heights of each one of these places is marked on a map and contour lines are drawn by interpolation. These lines are drawn at definite intervals such as 20, 50 or 100 meters.
It should always be in numbers ending with zero. Spacing of contours gives an idea of the slope or gradient. If contour lines are closer, it indicates a steep slope and gentle slope is indicated when on tours are widely spaced. Contour diagrams of some of the mator land forms are given in the figure which will help you understanding the slopes. The contour diagrams of slopes, hill, plateau, escarpment, cliff, river valley and lake are different from each other.
![]()
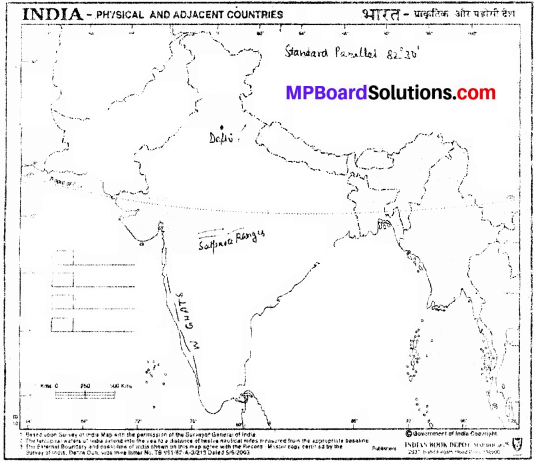
Mark the following in the outline map of India
Question 1.
- Standard Parallel 83°30
- Satpura Ranges
- River Ganga
- Western Ghats
- Delhi.
Answer:
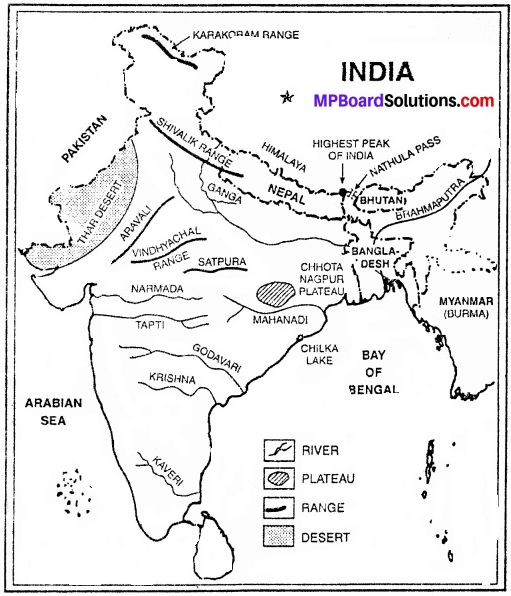
Question 2.
Show the following areas on the outline map of India –
- Karakoram range, Satpura (2008, 09, 10), Aravali range . (2008), Nathuia Pass (2012).
- Shivalik range (2006), Vindhyachal mountain ranges (2010, 12).
- Highest peak of Himalaya in India (Mount Everest) (2009).
- Chhotanagpur Plateau, Mahadev Ranges (2010).
- Ganga (2008, 09), Tapti, Krishna river (208, 09), Brahmaputra, Kaveri, Narmada (2008, 09).
- Thar desert (208, 09).
- Godavari river (2007), Mahanadi (2008).
- Chilka lake (2009).
- Arabian sea (2008, 09), (x) Himalaya (2012).
Answer:
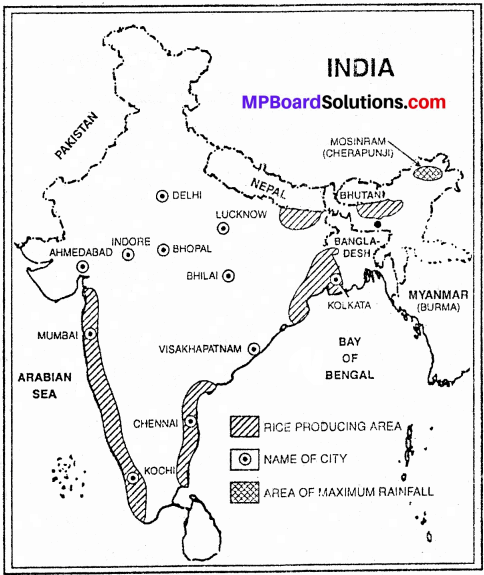
Question 3.
Show the following areas on the outline map of India:
- Delhi (2008, 09), Visakhapatnam, Bhilai, Bhopal (2008, 09, 12), Chennai (2009), Mumbai (2008, 09), Ahmedabad, Kochi, Indore, Lucknow and Kolkata.
- Rice producing area.
- Area of maximum rainfall (Cherapunji).
- Bay of Bengal (2008, 09).
Answer:
MP Board Class 9th Social Science Solutions