MP Board Class 9th Social Science Solutions Chapter 7 India: Population
MP Board Class 9th Social Science Chapter 7 Text Book Questions
Choose the Correct Answer:
Questions 1.
in which of the following period did the growth of population increase steadily?
(a) 1901-21
(b) 1921-51
(c) 1951-81
(d) 1981-2001
Answer:
(b) 1921-51
Questions 2.
According to 2001 census which is the most densely populated state?
(a) Uttar Pradesh
(b) Bihar
(c) Kerala
(d) West Bengal
Answer:
(a) Uttar Pradesh
Questions 3.
Which state has highest percentage of literacy?
(a) Uttar Pradesh
(b) Kerala
(c) Goa
(d) Delhi
Answer:
(b) Kerala
Questions 4.
Which is the most densely populated Union Territory?
(a) Chandigarh
(b) Pondicherry
(c) Delhi
(d) Lakshadweep
Answer:
(c) Delhi
![]()
Fill in the blank:
- Population density is ……………. in India.
- ………………. has the highest percentage of literacy in India.
- The president of national population commission is ……………
- World population day is celebrated on ………………. every year.
- Population wise India is the country in the world.
- In India the female population is ………….. ! ………….. then male population.
Answer:
- 382
- Kerala
- Prime Minister
- 17 July
- Second
- Less.
MP Board Class 9th Social Science Chapter 7 Very Short Answer Type Questions
Question 1.
What is birth rate?
Answer:
The number of live births for every thousand persons is called birth rate.
Question 2.
What is death rate?
Answer:
The number of deaths per thousand population in a year is called death rate.
Question 3.
What was the density of population in India in 2011?
Answer:
In the year 2011 population density of India was 382 persons per square km.
Question 4.
What was the sex – ratio in India in 2011?
Answer:
According to census 2011 the sex – ratio of the country was 943 (there are 943 females per thousand males) meaning that the number of females is less than number of males.
Question 5.
Population – wise and Area – wise what is the position of India in the world?
Answer:
Population – wise India is the second largest and area – wise the seventh largest country in the world.
![]()
MP Board Class 9th Social Science Chapter 7 Short Answer Type Questions
Question 1.
Write about any three problems resulting from population growth.
Answer:
Due to the population growth many problems are coming up in our country. Among many problems, there are given below:
- Poverty
- Unemployment
- Decline of standard of living
Question 2.
Why is the rate of sex – ratio declining in India? Give reasons.
Answer:
The rate of sex – ratio is declining in India due to the following reasons –
- Literacy is low among females.
- High maternal mortality rate.
- Desire of male child in a male dominating society.
- Increasing female foeticide.
- Neglecting girl child and considering girl child as a liability.
- Dowry system in the society causes female foeticide and encourage females towards suicide.
Question 3.
What do you understand by National Population Commission?
Answer:
Following National Population Policy 2000, National Commission on Population has been established. The Prime Minister is the President of this commission. Chief ministers of all States and Union Territories, administrators and ministers, in charge of all related departments and central ministers, renowned demographers and the representatives of public health and professional organizations and non – government organization are its members.
Following the National Population Policy 2000, state level population commissions like the National level population commission have also been formed. The chief ministers of the respective states are their .presidents.
Question 4.
What do you mean by sex – ratio? Explain its distribution in the country.
Answer:
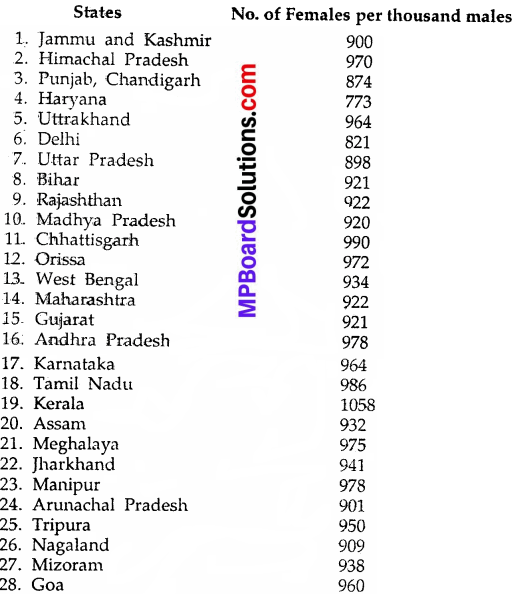
Sex – ratio means number of females per thousand males. According to census 2001 the sex – ratio for the country was 933 (there are 933 females per thousand males) meaning that the number of females is less than number of males. This means that the sex – ratio in India is adverse. When the number of females is more than males the sex – ratio is said to be favorable.
There are wide regional disparities in sex – ratio in India. When we will go through the map of distribution of male-female ratio we find that Kerala records favorable sex – ratio (1058).whereas in Chandigarh it is adverse (773)
The distribution of male – female ratio are as under:
![]()
MP Board Class 9th Social Science Chapter 7 Long Answer Type Questions
Question 1.
Give the main causes of population growth in India and the measures being taken to control it.
Answer:
The main causes of population growth in India are:
1. Birth – rate and death – rate:
During 1911 to 1921 birth – rale and death – rate were 48.1 and 47.2 respectively, meaning that both were quite high. From 1921 to 1951 though birth – rate decreased slowly but, death rate decreased rapidly. Between 1991 and 2001 difference between the two increased to 17.4 resulting in continuous growth of population. The cause of decline in death – rate was increase in health facilities and adequacy of facilities of livelihood.
2. Increase in Life Expectancy:
The difference between birth – rate and death-rate is called natural growth rate. The average age of life is known as life expectancy. In our country, life expectancy (average age) was 50 years in 1921 which increased to 62 years in 1991. Hence due to longevity population kept on increasing.
3. Lack of Education:
In education gives birth to superstition.. Most of the uneducated people believe that children are gift of God. Believing this they keep on begetting children and hence population also increases. Desire for son is also responsible for many children in one family. The lower class hesitate from adopting family welfare programmer.
4. Other Causes:
Poverty, lack of means of entertainment, low standard of living, child marriage and migration etc. are among the other causes of population growth. Due to population growth many problems are coming up in our country, such as poverty, unemployment, decline of standard of living, hunger, increasing crimes, housing problem, transport problems, lack of medical facilities and increasing pollution etc.
5. Measures to Control Population Growth:
If the population growth is not checked immediately, flow of development will be hampered in the future. Following measures are essential to control the growth of population.
- Family welfare programmer should be accepted.
- Spread of education especially women education should be increased.
- Child marriage should be prevented.
- Standard of living should be improved.
- Social security should be rapidly extended.
Question 2.
Explain with examples the factors affecting the density of population in India.
Answer:
The factors affecting the density of population in India are –
- Physical factors.
- Socioeconomic and cultural factors.
1. Physical Factors:
Terrain, climate, soil and minerals are main physical factors. Terrain affects distribution of population the most. On one hand, dense population is found in the plains of Ganga – Yamuna and coastal areas, whereas on the other hand in the hilly state of Arunachal Pradesh density of population is the lowest. Climatic condition also influences density and distribution of population.
Suitable climate is helpful to the health and efficiency of man. The dry deserts of western Rajastan and Arunachal Pradesh are sparsely population due to bad climate. Fertile soil is ideal for agricultrue. The agriculture crops are the fundamental bases of livelihood and sustenance.
Therefore, population clusters around the fertile plains of rivers. Availability of minerals and industrial development based on them has attracted population in the mineral areas of Chottanagpur Plateau. Thus population has become very dense in Chottanagpur Plateau region.
2. Socioeconomic and Cultural Factors:
Socioeconomic and cultural factors also play important role in the distribution and density of population. The cultural, social, historical and political factors have together raised the size and density of Do population in the Mumbai-Pune industrial area.
Many years from today Mumbai area was non – significant, but after the advent of Europeans its importance kept increasing and gradually it turned into commercial and industrial center, as a result its population increased. Today a large group of people go to stay from one place to another and from one country to another. This is called population migration. Population migration also affects a country’s population growth.
![]()
Question 3.
On the basis of population density, in how many parts India can be divided?
Answer:
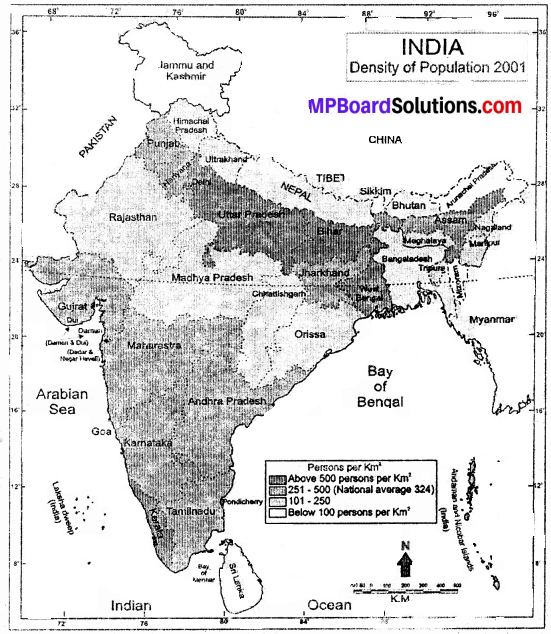
India can be divided in four parts on the basis of density.
1. High Density Areas:
If we look at the population density map of India, we find that more than 501 persons reside in per square km. area in Uttar Pradesh, Bihar, West Bengal and Kerala. The fertile land and availability of water provide enough facilities of sustenance. In these areas urbanization and industrialization have provided people with sufficient employment opportunities and services.
2, Medium Density Areas:
These include areas having population density of 251 to 500 persons per sq. km. Andhra Pradesh, Assam, Goa, Maharashtra, Tamilnadu, Jharkhand, Punjab, Haryana, Tripura, Dadra and Nagar Haveli fall under this category. Developed agriculture, availability of minerals and industrial development are some of the reasons for high (medium) population density in these areas.
3. Areas of Normal Density:
These include all those states which have population density ranging from 101 to 250 persons per sq. km. The States included in this category are M.P., Rajasthan, Orissa, Chhattisgarh, Uttaranchal, Meghalaya, Manipur and Nagaland. These are hilly and dissected semi arid, forest covered regions. Here the means of livelihood are quite limited.
4. Low Density Areas:
These include Jammu and Kashmir, Arunachal Pradesh, Mizoram, Sikkim and Andaman and Nicobar Islands. Hilly areas, lack of transport facilities, under – development of agriculture and industries are the responsible factors for low density. The means of livelihood are very limited here. In Arunachal Pradesh, density of population is as low as 13 persons per sq. km.
Question 4.
What is National Population Policy 2000?
Answer:
According to the new population policy, qualitative change of life is essential for socioeconomic development. This will ensure use of man as productive capital for the society. The policy has three objectives.
1. Short term objective:
To develop health and basic infra – structure for the extension of contraceptive measures.
2. Mid term objective:
To reduce the total rate of reproduction till 2010 and onward.
3. Long term objective:
To achieve the target of stable population for sustainable economic development till 2045.
In order to meet the above objectives following socio demographic aims were also declared under the new policy.
- To pay attention to the incomplete needs related to basic reproduction and health services, supplies and basic infrastructure.
- To impart free and compulsory school education till the age of 14 years. To reduce the number of dropouts among primary and middle standard boy and girl students up to 20%.
- To bring down the infant mortality rate below 100 per one lakh live births.
- To implement universal vaccination against diseases which are preventive.
- To encourage late marriage among girls. To stress the significance of marriage at the age of 20 plus.
- To ensure presence of trained midwives at all institutions.
- To find out expensive alternatives of contraception.
- 100% registration of birth, death, marriage and conception.
- To check the spread of AIDS, encourage integration between Aids control organizations with regards Reproductive Track Infection (RTI) and Venereal Diseases (VD).
- To make, ample efforts for prevention’ and control of infectious diseases!
- To integrate various types of Indian medicinal systems for providing’ reproductive and child health services at doorstep.
- To solidly ‘encourage the norm of small family in order to reduce’ fertility rate.
- To develop family welfare as people – oriented programmer.
![]()
Question 5.
What is the status of growth in literacy rate in India? Suggest your views to increase female literacy.
Answer:
After independence we had fast development in ail fields hut in the field of literacy continuous efforts are still needed.
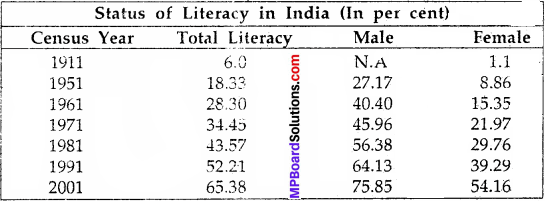
The Status of Growth in Literacy Rate in India:
Literacy rate has increased in last hundred years. It is evident from the table of status.’of literacy’ in India given on the next page that in the. beginning of the century in 1911 the literacy rate was about .6%. After Independence in’ 1951 it’has increased to 18.13%. It has increased . from 52.21% in 1991 to 65.38% in 2001 in female Literacy rate was 1.1% in 1911 which has increased to 54.16% in 2001. It is out come of the policy of Central Government aiming at providing free primary education to all.
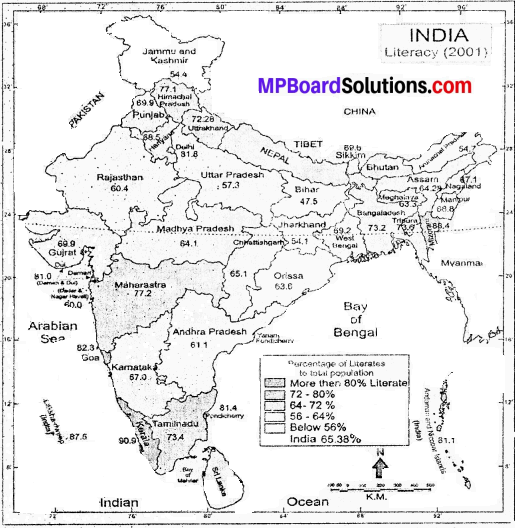
Disparities in Literacy Rates:
There are wide regional dis – parities in literacy rate. See the state – wise distribution of literacy in the map. It varies from 47.5% in Bihar to 90.9 in Kerala. Kerala is closely followed by Lakshadweep (87.5 percent) and Mizoram (88.4 per cent). Bihar ranks last in literacy among the states and union territories of India.
Male – female differentials are also wide. Only 54.16 per cent of the females are literate as against 75.85 per cent of males. There is much difference in the literacy rate of rural and urban population. In 2001 the literacy rate in urban areas was 79.9 per cent, whereas in rural areas it was only 58.7 per cent.
MP Board Class 9th Social Science Chapter 7 Other Important Questions
Choose the correct answer:
Question 1.
(i) India is the second most popular country of the world after –
(a) Australia
(b) China
(c) Japan
(d) None of the above
Answer:
(b) China
Question 2.
The population of Sikkim is –
(a) 2.2 crores
(b) 3.4.crores
(c) 5.4 lacs
(d) 6 crores
Answer:
(c) 5.4 lacs
Question 3.
In our country, life expectancy was 62 in the year –
(a) 1981
(b) 1991
(c) 2001
(d) 1987
Answer:
(b) 1991
Question 4.
Which states ranks first in literacy rate?
(a) West Bengal
(b) Madhya Pradesh
(c) Kerala
(d) Utter Pradesh
Answer:
(c) Kerala
Question 5.
On the basis of population density India can be divided into –
(a) Four Categories
(b) Three Categories
(c) Two Categories
(d) Six Categories
Answer:
(a) Four Categories
![]()
Fill in the blank:
- The first census of India was held in …………….
- Population census is released in ……………. year.
- The 500 croreth child was born in ………………..
- The state with lowest population density in India is …………….
- The density of population in 2011 was ……………. in Madhya Pradesh.
Answer:
- 1872
- 10
- Yugoslavia
- Arunachal Pradesh
- 236.
MP Board Class 9th Social Science Chapter 7 Very Short Answer Type Questions
Question 1.
Where do we find more population – in the plains or in the hilly or desert – areas?
Answer:
We find more population in the plains.
Question 2.
What is the population of Uttar Pradesh?
Answer:
The population of Uttar Pradesh is 19.9 crores.
Question 3.
Define ‘density of population’?
Answer:
The ratio of population of a country or state and its per unit area (square km.) is called its density.
Question 4.
What is the formula used to calculate density of population of a country or state?
Answer:
The formula is:
![]()
Question 5.
What was the population density of India in 2001?
Answer:
It was 324 persons per square km.
![]()
Question 6.
Divide India into four categories on the basis of population density.
Answer:
The four categories are:
- Areas of high density.
- Areas of medium density.
- Areas of normal density.
- Areas of low density.
Question 7.
Name the areas of high density.
Answer:
Uttar Pradesh, Bihar, West Bengal and Kerala.
Question 8.
Name the areas of low density?
Answer:
Jammu and Kashmir, Arunachal Pradesh, Mizoram, Sikkim and Andman and Nicobar Islands.
Question 9.
What is the natural growth rate?
Answer:
The difference between the birth – rate and tire death – rate is called the natural growth rate per year,
Question 10.
Name the state where we find favorable sex – ratio
Answer:
Kerala.
![]()
Question 11.
What was the literacy rate in urban areas in 2001?
Answer:
It was 79.9 per cent.
Question 12.
What will happen if the population growth is not checked?
Answer:
If the population growth is not checked flow of development will be hampered in the future.
Question 13.
Give one term for the number of women per thousand of population.
Answer:
Sex – ratio.
Question 14.
What is the life expectancy in India now?
Answer:
67 years.
Question 15.
Which state has the highest sex – ratio in India?
Answer:
Kerala. It is 1058 females to 1000 males.
Question 16.
What is the main cause of rapid population growth in India after independence?
Answer:
There has been – sharp fall in death – rate but very slow fall in birth – rate.
![]()
MP Board Class 9th Social Science Chapter 7 Short Answer Type Questions
Question 1.
What is density of population? How can density of population be calculated?
Answer:
Density of population is the number of people living per square kilometer of area. It represents the land man ratio. It can be calculated by dividing the total population of a region or country or state by its total area. It is expressed as the number of persons per square kilometer as 180 persons per square kilometer.
The distribution of population of India is extremely uneven. The average density for the country as a whole as per the census 1991 in India is 267 persons per sq. km. The density of population in India can be calculated by dividing total population with total area. Thus density of population = Total population s ÷ Total area.
Question 2.
Describe the areas m normal density.
Answer:
These include all the e states which have population density ranging from 101 to 250 persons per sq. km. The states included in this category are M.P. Rajastan, Orissa, Chhattisgarh, Uttaranchal, Meghalaya, Manipur, and Nagaland.
Question 3.
What measures can be taken to control population growth?
Answer:
Following measures can be taken to control the growth of population:
- Family welfare programmer should be accepted.
- Spread of education especially women education should be increased.
- Child marriage should be prevented.
- Standard of living should be improved.
- Social security should b’e rapidly extended.
![]()
Question 4.
‘Literacy’ rate has increased in last hundred years. Justify it.
Answer:
In the beginning of the century in 1911 the literacy rate was about 6%. After independence in 1951 it has increased to 18.3%. It has increased from 52.21% in 1991 to 65.38% in 2001. Female literacy rate was 1.1% in 1911 which has increased to 54.16% in 2001. Thus we can say that literacy rate has increased in last hundred years.
Question 5.
Mention the objectives of the National Population Policy 2000.
Answer:
The National Population Policy 2000 has three objectives –
- Short term objectives – To develop health and basic infrastructure for the extension of the contraceptive measures.
- Mid term objective – To reduce the total rate of reproduction till 2010.
- Long term objective – To achieve the target of stable population for sustainable economic development till 2045.
MP Board Class 9th Social Science Chapter 7 Long Answer Type Questions
Question 1.
Define birth and death rate. Explain growth rate. Also make a table to show growth rate in India (1901-2001).
Answer:
- The birth – rate is calculated in terms of number of live birth per thousand population per year.
- The death – rate is known as number of deaths per thousand population per year in a given area.
- The difference between these two is called the natural growth rate per year.
Growth rate in India (1901-2001):
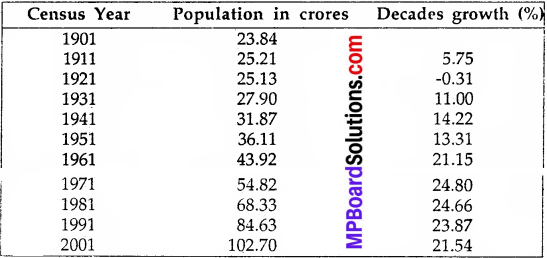
The growth rate of a population may be positive or negative. Positive growth rate means growth in the number of people living in an area, whereas negative growth means the number of people living in that area declines. Find out the population growth rate m India from the table given above and see whenever the growth was negative.
![]()
Question 2.
What are the main features of population situation in India?
Answer:
The main features of India’s population can be summarized as below:
1. Size of India’s Population:
India is the second largest populated country in the world, after China. Population of India has been constantly rising since 1921. The following figures indicate the size, of India’s population.
Population of India
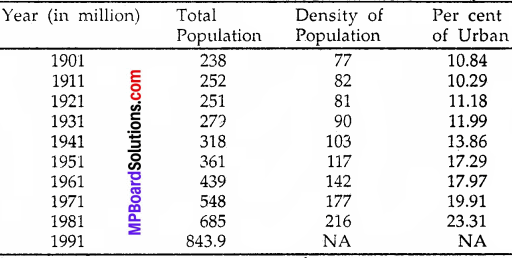
It will be seen from the above table that in just 34 years after independence another India was added while the territorial limit of the country remained unchanged. It is estimated that if we grow with this number, we will be more than 100 crore mark at the end of this century.
2. Second Largest Populated Country:
India has 2.4 per cent of the total land area of the world, India caters to the needs of 15% of the total world population. This means every seventh person in the world is an Indian.
3. Population Increasing at a Fast Rate:
It is not the overall absolute size of population which is the cause of concern, equally important is the fact that India’s population has been rising at a relatively very fast rate. It has gone up by a little over 2.0 per cent annum during the period 1951 to 1991 and about 2.1% presently.
4. Density of Population:
The density of population of India in 1961 was 216 persons per.sq. km. It rose to 267 in 1991. Thus the land man has been declining fast which indicates that the land will fall short for the in habitation of mankind of the population grow in this rate.
5. Uneven Distribution of Population:
The population is unevenly distributed. The northern plains, coastal plains and some river valley in lower Himalayas are densely populated while other areas of scanty rainfall or desert plateau and mountainous areas are sparsely populated. Thus there are areas which have great population pressure while other rare less inhabited.