MP Board Class 9th Maths Solutions Chapter 14 Statistics Ex 14.3
Question 1.
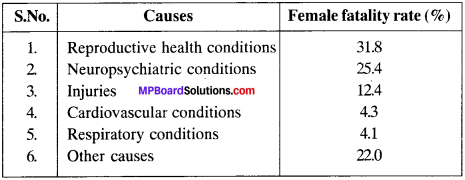
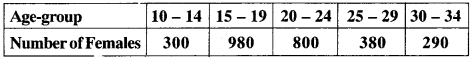
A survey conducted by an organisation for the cause of illness and death among the women between the ages 15 – 44 (in years) worldwide, found the following figures (in %):
- Represent the information given above graphically.
- Which condition is the major cause of women’s ill health and death worldwide?
- Try to find out, with the help of your teacher, any two factors which play a major role in the cause in (ii) above being the major cause.
Solution:
1.
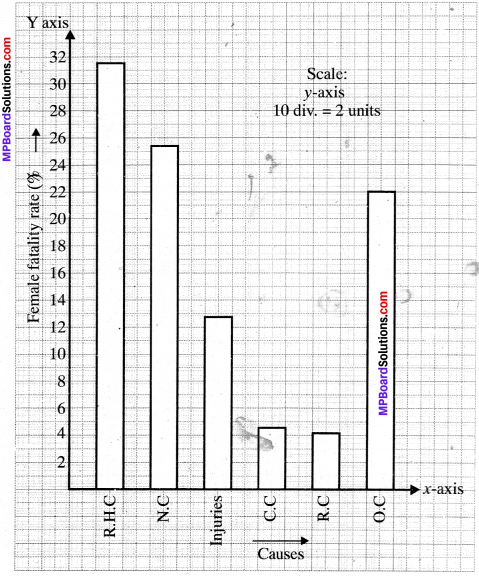
2. Major cause of women’s ill health and death worldwide is reproductive health conditions (RHC).
3. Try to do it with the help of your teacher.
![]()
Question 2.
The following data on the number of girls (to the nearest ten) per thousand boys in different sections of Indian society is given below.
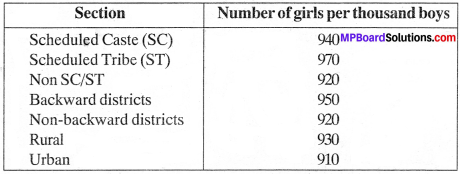
- Represent the information above by a bar graph.
- In the classroom discuss what conclusions can be arrived at from the graph.
Solution:
1.
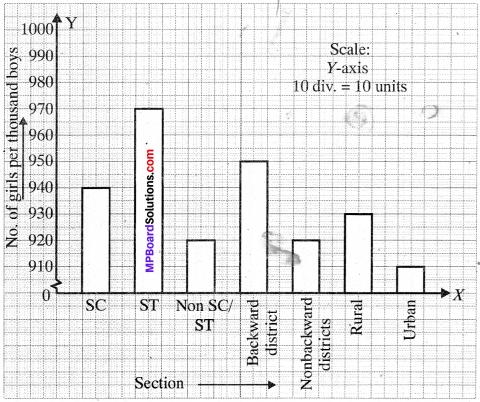
2. From the graph we can say that ratio of girls/boys is more in sched¬uled tribe of Indian society.
Question 3.
Given below are the seats won by different political parties in the polling outcome of a state assembly elections:
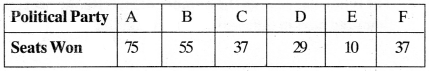
- Draw a bar graph to represent the polling results,
- Which political party woe the maximum number of seats? Sol. (0
Solution:
1.
2. Political party ‘A’ won the maximum number of seats.
Question 4.
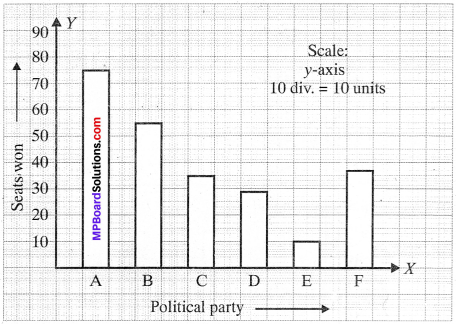
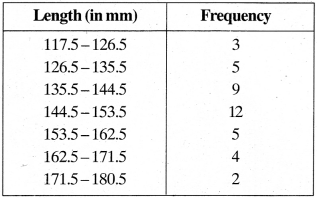
The length of 40 leaves of a plant are measured correct to one millimetre, and the obtained data is represented in the following table:
- Draw a histogram to represent the given data.
- Is there any other suitable graphical representation for the same data?
- Is it correct to conclude that the maximum number of leaves are 153 mm long? Why?
Solution:
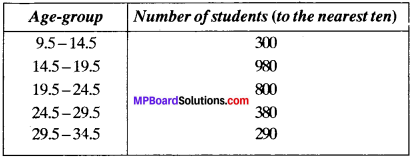
1. The given frequency distribution is in discontinuous (inclusive) form. To draw histogram, first it is to be converted into continuous form as given in the table below:
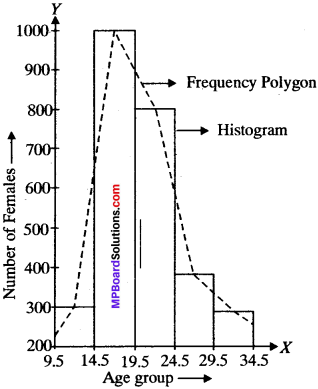
Histogram is shown in Fig.
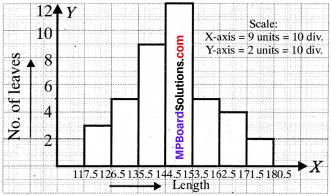
2. Frequency polygon.
3. No.
![]()
Question 5.
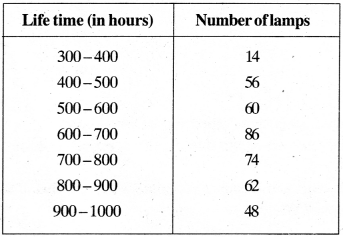
The following table gives the life times of 400 neon lamps:
- Represent the given information with the help of a histogram.
- How many lamps have a life time of more than 700 hours?
Solution:
1.
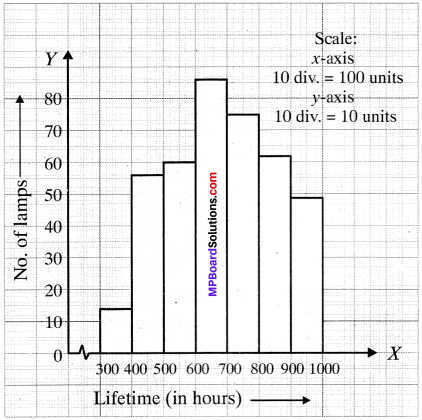
2. No. of lamps having a life time more than 700 h = 74 + 62 + 48 = 184.
Question 6.
The following table gives the distribution of students of two sections according to the marks obtained by them:
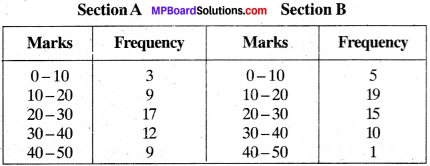
Represent the marks of the students of both the sections on the same graph by two frequency polygons. From the two polygons compare the performance of the two sections.
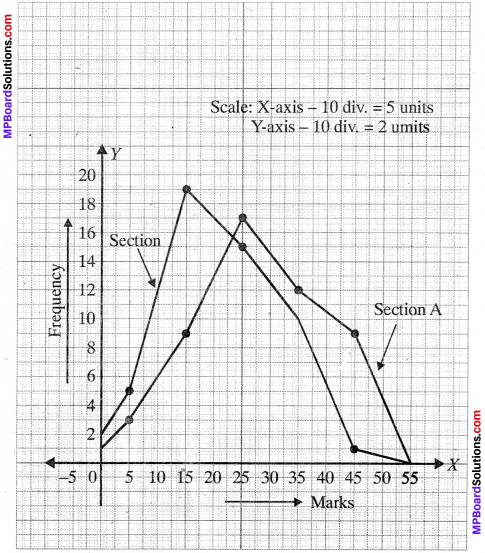
Solution:
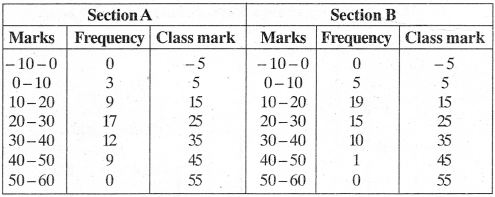
As the marks cannot be negative, we will not join the lines to – 5 but will end on the Y – axis as shown in the figure.
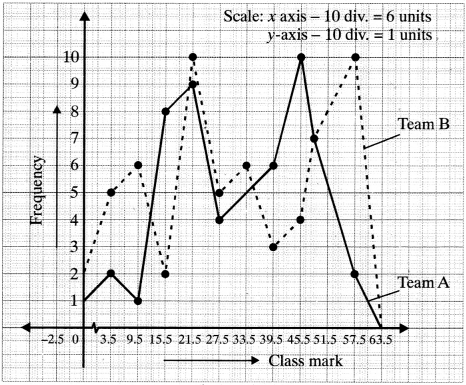
Question 7.
The runs scored by two teams A and B on the first 60 balls in a cricket match are given below:
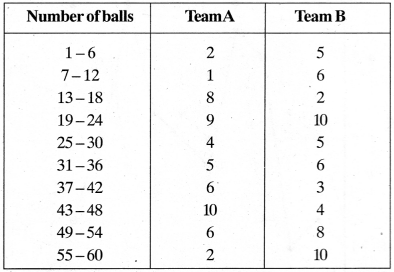
Represent the data of both the teams on the same graph by frequency polygons.
Solution:
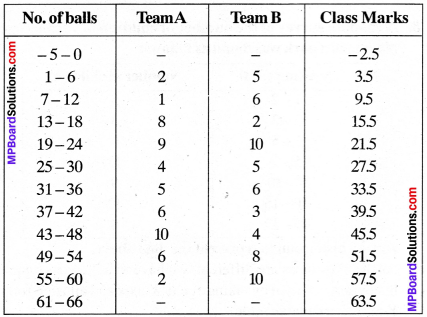
As the runs scored cannot be negative, we will not join the lines to – 2.5 but will end on the Y – axis as shown in the figure.
Question 8.
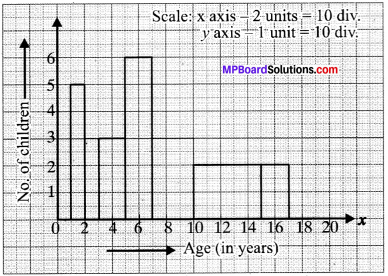
A random survey of the number of children of various age groups playing in a park was found as follows:
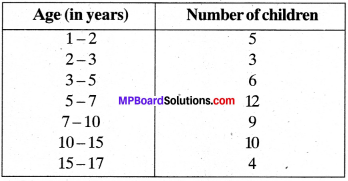
Draw a histogram to represent the data above.
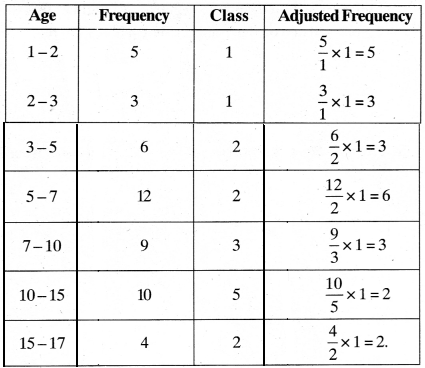
Solution:
As the class sizes are different, we have to adjust the frequency and histogram is drawn by taking age in X-axis and ajiusted frequency in E-axis on a suitable scale.
Question 9.
100 surnames were randomly picked up from a local telephone directory and a frequency distribution of the number of letters in the English alphabet in the surnames was found as follows:
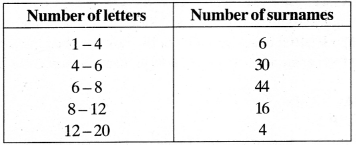
- Draw a histogram to depict the given information.
- Write the class interval in which the maximum number of surnames lie.
Solution:
1.
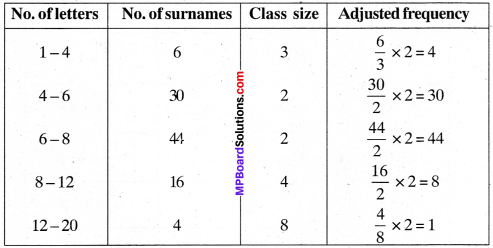
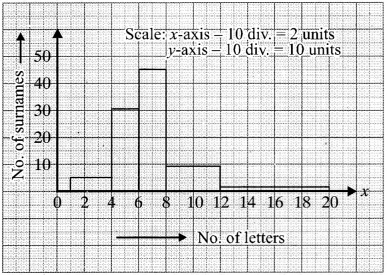
2. The class interval in which the maximum number of surnames lie is 6-8.
Graphical Representation Of Statistical Data:
Through classification and tabulation, we present the data in such a way that the essential characteristics of the raw data become readily under¬stood. The further step in analysis is to represent the statistical data in either of the two ways:
- Diagrams
- Graphs
Diagrams and graphs appeal to the eyes and mind of every man. This is the reason why newspapers and periodicals represent diagram in advertisements. There are many different methods used to represent data by means of pictures.
Graphs: The important types of graphs are as follows:
- Bar Diagram
- Histogram or frequency histogram
- Frequency polygon
- Cumulative frequency curve or an ogive.
1. Bar Diagram:
This is common type of representation used by businessmen and economists. Census uses it to denote population density etc. in different states. If we have to compare simple magnitudes, we use this graphical representation.
As the name suggests, it consists of wide thick lines whose width is not taken into account. It is only the length of the bar which gives comparative analysis. It is for this reason that we call it one dimensional.
2. Histogram or Frequency Histogram:
A histogram is a graph which represents the class frequencies in grouped frequency distribution by vertical adjacent rectangles with class- intervals as bases and the corresponding frequencies as heights.
Drawing of Histogram:
To draw the histogram of a given frequency distribution, we go through the following steps:
- We represent the class-limits along T – axis on a suitable scale.
- We represent the frequencies along Y – axis on a suitable scale.
- We construct rectangles with bases along X – axis and heights of X – axis.
3. Frequency Polygon
A frequency polygon is a graphical representation of a frequency distribution in which the mid-points of the class-intervals represent the entire class-intervals.
![]()
Drawing of Frequency Polygon:
When a grouped frequency distri – bution with equal class-intervals is being given, then to draw the frequency polygon, we go through the following steps:
- We represent the class marks along Y – axis on a suitable scale.
- We represent the frequencies along Y – axis on a suitable scale.
- Plot these points and join them by a straight line.
- We complete the diagram in the form of a polygon by taking two more classes, one at the beginning and the other at the end.
4. Cumulative Frequency Curve or an Ogive:
The cumulative frequency curve or an ogive is a graph of cumulative frequency distribution. To represent an ogive or cumulative frequency curve, we mark the upper class limits along the X – axis and the cumulative frequencies along the Y – axis. Plot the points and join them by a free hand smooth curve. This graph is a rising curve.
Drawing an Ogive or Cumulative Frequency Curve:
There are two types of methods to constructing an ogive or cumulative frequency curve:
- Less than method
- More than method.
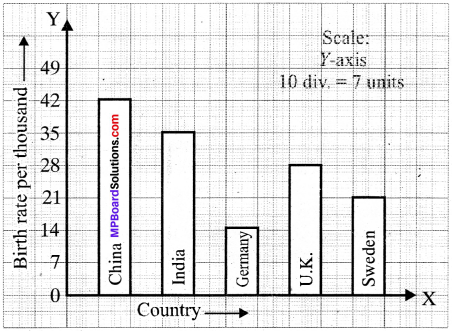
Example 5:
The birth per thousand in five countries over a period of time is shown below:
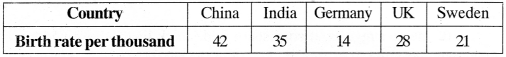
Solution:
Take country on X – axis and birth rate per thousand on Y – axis. Bar graph is shown in Fig.
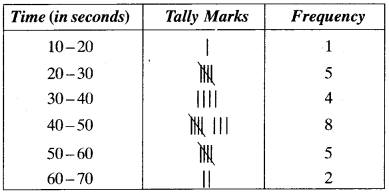
Example 6:
The time taken, in seconds, to solve a problem for each of 25 pupils is as follows:
20, 52, 64, 60, 59, 58, 53, 50, 49, 48, 46, 46, 46, 46, 43, 42, 40, 38, 37, 33, 30, 28, 27, 26, 20, 16
- Construct a frequency distribution for these data, using a class – interval of 10 seconds.
- Draw a histogram to represent the frequency distribution.
Solution:
1. The required frequency distribution table is given below:
2. Bar Diagram
Example 7:
Draw a histogram and a frequency polygon to represent the above data.
Solution:
Now first we convert the given class-intervals into continuous class-intervals. Then the given frequency distribution takes the following form:
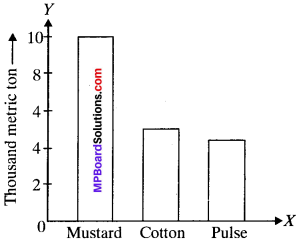
Example 8:
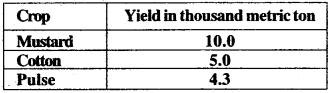
The following table shows the yield of pulses, mustard and cotton in the year 2000-2001 in the State of U.P. Prepare a bar diagram.
Solution:
1. Draw a horizontal line on a sheet of paper (or graph paper). It is called Y – axis.
2. Leaving little space on the left draw a line perpendicular to the horizontal line. It is called Y – axis.
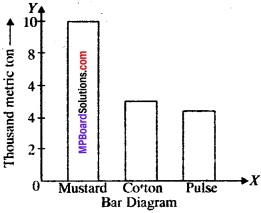
3. On the horizontal line i.e., X-axis, mark number of points equal to number of items (in the given question only three) at the equal distances.
4. Write down items (in the given question i.e., mustard, cotton and pulse) on the X-axis i.e., horizontal line below marked points.
5. Show the other variable, after taking suitable scale, on the vertical line i. e., Y-axis. The biggest number to be shown is 10 metric ton. So we take 10 small divisions i.e., 1 cm on Y-axis equal 2000 metric ton.
![]()
Example 9:
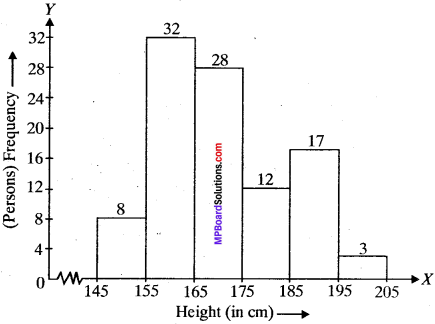
Heights of 100 persons (in cm) are given below. Show this by a histogram.
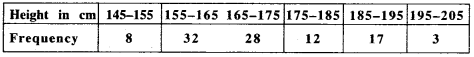
Solution:
Example 10:
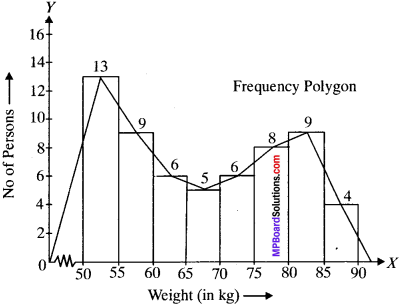
Weights of 60 persons (in kg) are given below. Show this by a frequency polygon.
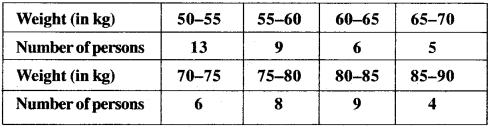
Solution:
Example 11:
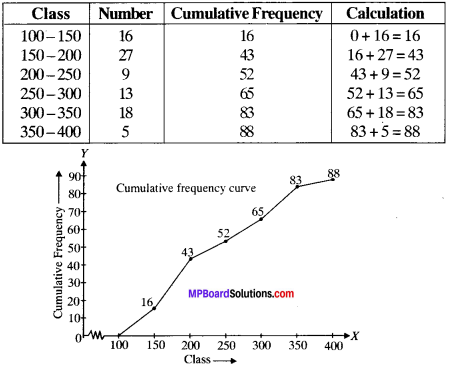
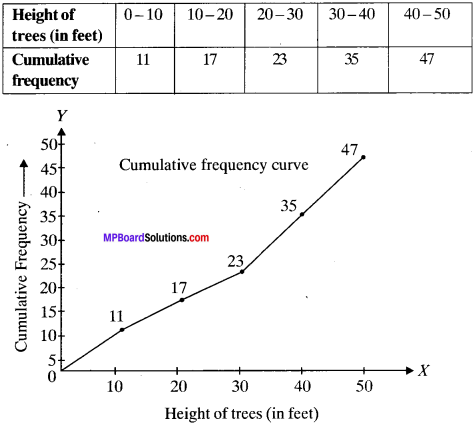
Make a cumulative frequency curve of the following data:
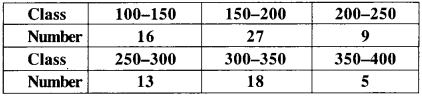
Solution:
Cumulative frequency table
Example 12:
Make a cumulative frequency curve for following distribution
Solution:
The cumulative frequency table for the given distribution is as under:
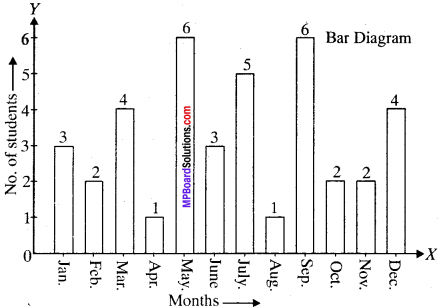
Example 13:
Following are the date of births of students of class 9, born different months, show it by a bar graph.
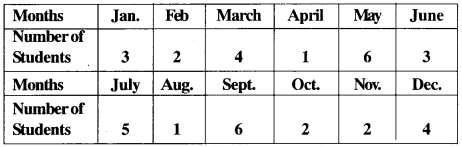
Solution:
Measures Of Central Tendency:
An average of a data is the value of the variable which describes the characteristics of the entire data and representative of entire distribution. An average is called measure of central tendency because its values lie between two extremes, largest and smallest observation. The measures of central tendency which are useful for analyzing data are.
- Mean
- Median
- Mode.
1. Mean:
The sum of the values of all the observations divided by the total number of observations.
It is denoted by the symbol \(\overline { x } \), read as x bar.
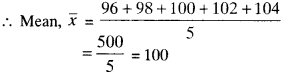
Example 14:
Find the mean of the numbers 96, 98, 100, 102, 104.
Solution:
Here number of observations are x = 5, and given numbers are 96, 98, 100, 102, 104.
![]()
Example 15:
The following table shows the age distribution of cases of a certain disease reported during a year is a particular city.
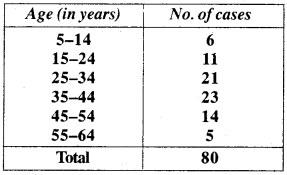
Find the average age (in years) per case reported.
Solution:
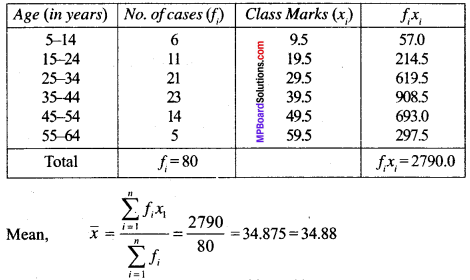
Hence, average age per case reported is 34.88 years.
2. Median:
The median is that value of the given number of observa-tions, which divides it into exeactly two parts. After arranging the given data in ascending or descending order of magnitude, the middle value of the observation is called the median.
- Arrange the given data is ascending or descending order.
- Find the total no of observations (n) in the given data.
- In case of odd observation (n)
Median = Value of (\(\frac{n+1}{2}\)) observation
In case of even number observation (n)
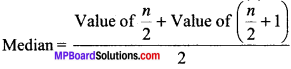
Example 16:
Find the median of the following values of a variable:
5, 10, 3, 7, 2, 9, 6, 2, 11
Solution:
Arranging the data in ascending order, we get
2, 2, 3, 5, 6, 7, 9, 10, 11
Here, n = 9, which is odd
Median = Value of (\(\frac{n+1}{2}\))th term
= Value of (\(\frac{9+1}{2}\))th term = Value of 5th term
Thus the median of given data is 6.
![]()
Example 17:
Find the median of the following data:
38, 70, 48, 34, 42, 55, 63, 46, 54, 44
Solution:
Arranging the data is ascending order, we get 34, 38, 42, 44, 46, 48, 54, 55, 63, 70
Here, n = 10, which is even
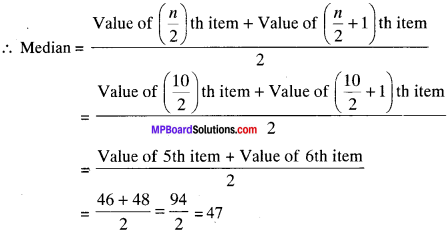
Thus, the median of given data is 47.
Example 18:
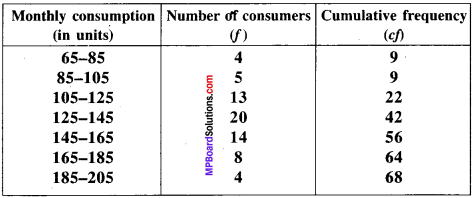
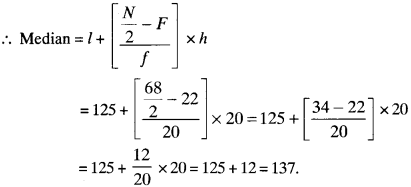
The following frequency distribution gives the monthly consumption of electricity of 68 consumers of a locality. Find the median.
Solution:
Here, N = 68. i.e., Value of (\(\frac{N}{2}\))th term = 34
So, median class is 125 – 145,
l = 125, F = 22, h = 20
Example 19:
Obtain the median for the following distribution:
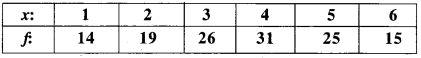
Solution:
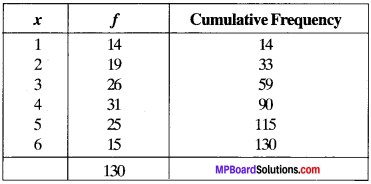
Here, N = 130, so Value of (\(\frac{N}{2}\))th term = 65.
The cumulative frequency just greater than 65 is 90 in the table and the variable corresponding to 90 is 4. Hence, median is 4.
3. Mode:
The mode is that value of observation which occurs most frequently i.e., an observation with maximum frequency is called the mode.
Example 20:
Find the mode for the following data:
110, 120, 130, 120, 110, 140, 130, 120, 140, 120
Solution:
Arranging the data is the form of a frequency table
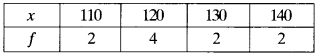
Since the value 120 occurs maximum number of items, i.e., 4. Hence the modal value is 120.
Example 21:
A survey conducted on 20 households in the following frequency table for the number of family members.
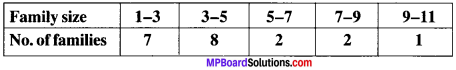
Find die mode of above data.
Solution:
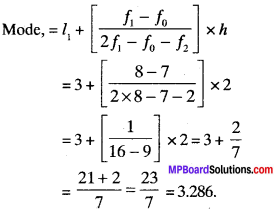
Here, Maximum frequency = 8
The corresponding class interval = 3 – 5
So, for the given table, we have
l1 = lower limit of modal class = 3
h = Class size = 2
f1 = frequency of modal class = 8
f0 = frequency of class preceding the modal class = 7
f2 = frequency of class succeeding the modal class = 2
We know that,