MP Board Class 11th Economics Important Questions Unit 3 Statistical Tools and Interpretation
Statistical Tools and Interpretation Important Questions
Statistical Tools and Interpretation Objective Type Questions
Question 1.
Choose the correct option:
Question (a)
The most common measurement of central tendency is:
(a) Median
(b) Multiple
(c) Mean
(d) Weighted mean.
Answer:
(c) Mean
Question 2.
Division of one column in ten equal parts is called:
(a) Decile
(b) Quartile
(c) Percentile
(d) None.
Answer:
(a) Decile
![]()
Question 3.
Which of the following equation is correct:
(a) Anova = σ
(b) Anova = σ -2
(c) Anova = σ 4
(d) Anova = √σ × 2.
Answer:
(b) Anova = σ -2
Question 4.
Where is correlation multiple placed:
(a) Between 0 and + 1
(b) Between – 1 and 0
(c) Between – 1 and + 1
(d) None of these.
Answer:
(c) Between – 1 and + 1
Question 5.
Base year is:
(a) Comparison year
(b) Present year
(c) Any year
(d) One year previous to present year.
Answer:
(a) Comparison year
![]()
Question 2.
Fill in the blanks:
- Rule of ……………………….. is supposed to be idle for creation of index.
- Multiple is the value of column in which ……………………… comes repeatedly.
- The value which divides the column into more than two parts is called ……………………………
- ………………………. is the difference between maximum and minimum value.
- …………………………. is the simple ray that shows relation between two values.
Answer:
- Fisher
- Maximum
- Division
- Range
- Analogical relation.
Question 3.
Match the columns:
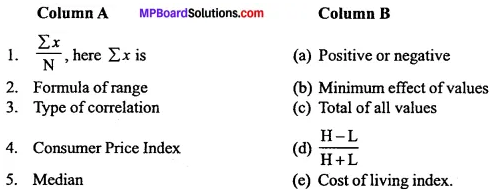
Answer:
- (c)
- (d)
- (a)
- (e)
- (b).
Question 4.
State true or false:
- Cumulative frequency shows “less than” or “more than” of any sequence.
- 5 is the mode of the numbers 3, 4, 3, 5, 5, 3, 2.
- Range is found by adding highest value and smallest value.
- Money inflation is measured on changes of index number of whole sale market of weekly statement.
- High income leads high savings.
Answer:
- True
- False
- False
- True
- True.
![]()
Question 5.
Answer in one word:
- Graphic method of studying dispersion.
- Definite relation between two or more groups.
- One which divides column in ten equal parts.
- In India which index helps to measure average change in prices.
- Saving is directly related to.
Answer:
- Lorenz curve
- Correlation
- Deciles
- Consumer Price Index
- Income.
Statistical Tools and Interpretation Very Short Answer Type Questions
Question 1.
What is measure of central tendency?
Answer:
Measure of central tendency is the single value which represents the characteristics of the entire universe.
Question 2.
Which is the popular measure of central tendency?
Answer:
Arithmetic mean.
Question 3.
Define Arithmetic mean?
Answer:
It is defined as the sum of the values of all observations divided by the number of observations.
![]()
Question 4.
Find out mode from the following data:
7, 12, 8, 5, 9, 10, 9, 11, 96
Answer:
9 is the number which is repeated maximum number of times. Hence, mode is 9.
Question 5.
Write the formula of weighted arithmetic mean?
Answer:
Weighted Arithmetic Mean = \(\frac{ΣWx}{ΣW}\)
Question 6.
Arrange the following series in descending order:
5, 16, 18, 2, 13, 15, 3, 19, 17, 20.
Answer:
20, 19, 18, 17, 16, 15, 13, 5, 3, 2
Question 7.
Name any two positional averages?
Answer:
- Median and
- Mode.
Question 8.
What is median?
Answer:
Median is that value which divides a series into two equal parts.
Question 9.
Write the formula of median in discrete series?
Answer:
Median (M) = size of (\(\frac{N+1}{2}\))th item.
Question 10.
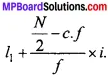
Write the formula of median in continuous series?
Answer:
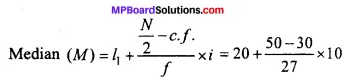
Median (M) =
Question 11.
What is Quartile?
Answer:
It divides the series into four equal parts. These are three quartiles Q1, Q2 and Q3.
Question 12.
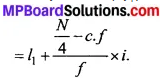
Write the formula of first quartile?
Answer:
First Quartile (Q1) =
Question 13.
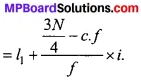
Write the formula of third quartile?
Answer:
Third quartile (Q3) =
Question 14.
What is a mode?
Answer:
Mode is defined as that value which occurs the most frequently in the distribution.
Question 15.
Write the formula to calculate mode?
Answer:
Mode Z =
Question 16.
Write the names of two measures of central tendency which can be determined from graph paper?
Answer:
- Median and
- Mode.
Question 17.
Which is the mostly used measure of central tendency?
Answer:
Mean.
Question 18.
Which measure of central tendency is not affected by extreme values?
Answer:
Median.
Question 19.
What is Percentile?
Answer:
Percentile divides the series into 100 equal parts.
![]()
Question 20.
Which measure of central tendency is used to explain qualitative data?
Answer:
Mode.
Question 21.
Name the measure of central tendency which is based on all items?
Answer:
Mean.
Question 22.
Define measure of dispersion?
Answer:
Dispersion measures that extent to which different items tend to disperse away from an average.
Question 23.
What is Range?
Answer:
Range is the difference between the highest value and lowest value in a series.
Question 24.
Write the formula of range?
Answer:
Range = Highest value in series – Lowest value in series.
Question 25.
Define Quartile deviation?
Answer:
Quartile deviation is the half of inter quartile range.
![]()
Question 26.
Write the formula of quartile deviation?
Answer:
Quartile deviation = \(\frac { Q_{ 3 }-Q_{ 1 } }{ 2 } \)
Question 27.
Write the formula of coefficient of quartile deviation?
Answer:
Coefficient of quartile deviation = \(\frac{Q_{3}-Q_{1}}{Q_{3}+Q_{1}}\)
Question 28.
Define mean deviation?
Answer:
It is the arithmetic mean of the deviations of various items from their average.
Question 29.
Write the formula of coefficient of mean deviation?
Answer:
Coefficient of mean deviation = \(\frac { MD }{ \overline { XorMorZ } } \)
Question 30.
Define standard deviation?
Answer:
Standard deviation is the square root of the arithmetic mean of the squares of all deviation.
Question 31.
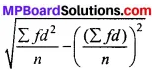
Write the formula of standard deviation?
Answer:
Standard deviation =
Question 33.
What is coefficient of variation?
Answer:
It is the percentage variation in the mean, the standard deviation being considered as the total variation in the mean.
Question 34.
Write the formula of coefficient of variation?
Answer:
Coefficient of variation = \(\frac { \sigma }{ \overline { X } } \) × 100.
Question 35.
What does Lorenz curve show?
Answer:
Lorenz curve is the graphic representation of dispersion in a distribution. It shows the actual distribution of items.
Question 36.
What is coefficient of correlation?
Answer:
Correlation is an analysis of covariation between two or more variables.
Question 37.
What is positive correlation?
Answer:
Correlation is said to be positive when two variables move together in the same direction.
![]()
Question 38.
What is negative correlation?
Answer:
Correlation is said to be negative when two variables move together in the opposite direction.
Question 39.
If coefficient of correlation is zero then what does it mean?
Answer:
There is no correlation between two variable.
Question 40.
Write the formula of Karl Pearson to calculate correlation?
Answer:
\(r=\frac{\sum x y}{N \sigma_{1} \sigma_{2}}\)
Question 41.
When is Spearman’s rank difference method used?
Answer:
When variables are qualitative like Beauty, Bravery, Ability, Intelligence etc.
Question 42.
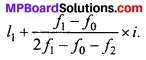
Write the formula of Spearman’s rank difference method?
Answer:
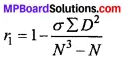
Question 44.
What is the measure of Index in base year?
Answer:
100.
Question 45.
What is base year?
Answer:
Base year is the year of reference with which the extent of change in the current year is measured.
Question 46.
Write two types of Index number?
Answer:
- Simple Index number and
- Weighted Index number.
Question 47.
What is simple index number?
Answer:
These are the index numbers in which all items of the series are accorded equal importance.
![]()
Question 48.
What is weighted index number?
Answer:
These are the index numbers in which different items of the series are accorded different weightage, depending upon their relative importance.
Question 49.
Who publishes wholesale price index in India?
Answer:
Central statistics organization (CSO).
Question 50.
What does wholesale price index show?
Answer:
It measures the relative changes in the prices of commodity traded in the wholesale markets.
Question 51.
On which basis wholesale price index is available in India?
Answer:
Weekly basis.
![]()
Question 52.
What is the other name of consumer price index?
Answer:
Cost of living index.
Question 53.
Define consumer price index?
Answer:
Consumer price index is the index number which measures the average change in prices paid by the specific class of consumers for goods and services consumed by them in the current year in comparison with base year.
Question 54.
What is base year of Index number of Industrial production?
Answer:
1993 – 1994.
Question 55.
What is Assumed mean?
Answer:
Assumed mean is the value of a series which helps in calculating the arithmetic mean.
![]()
Question 56.
What is senses?
Answer:
Sensex is an index representing the movement in share price of major companies listed in Bombay stock exchange.
Question 57.
What is the base year of sensex?
Answer:
1978 – 1979.
Question 58.
How many companies are included in sensex?
Answer:
30.
Question 59.
What does it mean when sensex goes up?
Answer:
If sensex goes up it means that the prices of the stocks of most of the companies under BSE sensex have gone up.
Statistical Tools and Interpretation Short Answer Type Questions
Question 1.
A measure of dispersion is a good supplement to the central value in under – standing a frequency distribution? Comment?
Answer:
Dispersion is the extent to which values in a distribution differ from the average of the distribution. Knowledge of only average is insufficient as it does not reflect the quantum of variation in values. Measures of dispersion enhance the understanding of a distribution considerably by providing information about how much the actual value of items in a series deviate from the central value, e.g., per capita income. Thus, a measure of dispersion is a good supplement to the central value in understanding a frequency distribution.
![]()
Question 2.
Which measure of dispersion is the best and how?
Answer:
Standard deviation is considered to be the best measure of dispersion and is therefore the most widely used measure of dispersion.
- It is based on all values and thus provides information about the complete series.
- It is independent of origin but not of scale.
- It is useful in advanced statistical calculations like comparison of variability in two data sets.
- It can be used in testing of hypothesis.
- It is capable of further algebraic treatment.
Question 3.
Some measures of dispersion depend upon the spread of values whereas some calculate the variation of values from a central value. Do you agree?
Answer:
Yes, it is true that some measures of dispersion depend upon the spread of values, whereas some calculate the variation of values from the central value. Range and Quartile Deviation measure the dispersion by calculating the spread within which the value lie. Mean deviation and standard deviation calculate the extent to which the values differ from the average or the central value.
![]()
Question 4.
In town, 25% of the persons earned more than? 45,000 whereas 75% earned more than 18,000. Calculate the absolute and relative values of dispersion?
Answer:
25% of the persons earned more than 45,000. This implies that upper quartile Q3 = 45,000 75% earned more than 18,000. This implies that lower quartile Q1 = 18,000. Absolute measure of dispersion = Q3 – Q1 = 45,000 – 18,000 = 27,000
Relative measure of Dispersion:
Co – efficient of Quartile Deviation = \(\frac { Q_{ 3 }-Q_{ 1 } }{ Q_{ 3 }+Q_{ 1 } } \) where Q3 = 3rd Quartile Q1 = 1st Quartile
= \(\frac{45,000-18,000}{45,000+18,000}\) = \(\frac{27,000}{63,000}\)
Question 5.
When is rank correlation more precise than simple correlation coefficient?
Answer:
Rank correlation is more precise than simple correlation coefficient in the following situations:
1. When the measurement of the variables are suspect e.g., in a remote village where measuring rods or weighing scales are not available, height and weight of people cannot be measured precisely but the people can be easily ranked in terms of height and weight.
2. When data is qualitative: It is difficult to quantify qualities such as fairness, honesty etc.
3. When data has extreme values: Sometimes the correlation coefficient between two variables with extreme values may be quite different form the coefficient without the extreme values. Under these circumstances rank correlation provides a better alternative to simple correlation.
![]()
Question 6.
Does zero correlation mean independence?
Answer:
No, zero correlation does not mean independence. If there is zero correlation (rXY= 0), it means the two variables are uncorrelated and there is no linear relation between them. However, other types of relation may be there and they may not be independent.
Question 7.
Why do we need on Index number?
Answer:
Index number are needed due to the following reasons:
- Measurement of change in the price level or the value of money.
- Information of foreign trade.
- Calculating real wages.
- Measuring and comparing output.
- Policy making of government.
Question 8.
What are the desirable properties of the base period?
Answer:
Base period should have the following properties:
- The base year should be a normal period and periods in which extraordinary events have occurred should not be taken as base periods as they are not appropriate for general comparisons.
- Extreme value should not be selected as base period.
- The period should not be too far in the past as comparison with current period cannot be done with such base year as policies, economic and social conditions change with time.
- It should be updated periodically.
Question 9.
Why is it essential to have different CPI for categories of consumers?
Answer:
The Consumer Price Index (CPI) in India is calculated for different categories as under:
- CPI for industrial workers.
- CPI for urban non – manual employees.
- CPI for agricultural labourers.
![]()
Question 10.
What is the difference between a price index and a quantity index?
Answer:
The difference between a Price index and a Quantity index:
Price Index:
- It measure and allow for comparison of the prices of certain goods.
- Its widely used.
- It is known as unweighted index numbers.
Quantity Index:
- It measure the changes in the physical volume of production construction or employment.
- Its narrowly used.
- It is known as weighted index numbers.
Question 11.
“Index numbers are Economic Barometers”? Explain?
Answer:
Index numbers are used to measure the level of economic activities like barometers. They are called as barometers due to following reasons:
- Wholesale price index number shows the changes in general price level which can be used for any consumer category.
- Index number of agricultural production is a weighted average of quantity relatives.
- Index number is a useful guide to help in decision making while investing in the stock market.
Question 12.
What is “mode”? Explain its merits?
Answer:
The word “mode” has been derived from the French word “La mode” which means fashion. In statistics, mode means the value, which occurs most frequently in the series. Following are the merits of mode:
1. Simple calculation:
Calculation of mode is simple. Sometimes in individual and discrete series it can be found out by inspection only.
2. Least effect of extreme values:
Mode is not affected by extreme values. If the groups are unequal even then mode can be calculated.
3. Representative measure:
Mode is a representative and real measure of the series because this is one of the values from the group itself.
4. Use in quantitative facts:
Mode is also used for describing the quantitative data.
![]()
Question 13.
Explain the merits and demerits of Karl Pearson’s coefficient of correlation?
Answer:
Merits:
- This method gives us precise magnitude of the correlation due to which interpretation of result becomes easy.
- It is the most popular method of measuring relationship between the two variables.
- It expresses the direction and degree of change in two variables.
Demerits:
- It cannot be used to quantity qualities such as honesty fairness, etc.
- The value of correlation are largely affected by the values of extreme items.
![]()
Question 14.
Explain the merits and demerits of Spearman rank difference method?
Answer:
Merits:
1. Simple:
Spearman’s ranking method is very simple compare to Pearson’s method. It can be easily calculated and understood than Pearsonian coefficient of correlation. In Karl Pearson’s method more calculation are required
2. Compulsory calculations:
In case ranks of values in the series are given rank methods is the only way to compute coefficient of correlation.
3. Useful for data of qualitative nature:
In case the data is related to ability, performance, beauty, honesty, intelligence and honesty etc. So this is the most suitable method to calculate coefficient of correlation.
4. Same result:
The answer obtained by rank method equals the answers determined through Pearsonian method, if values are not repeated.
5. Convenient:
This method can be used convenient by even if numbers in series are given in irregular way.
6. Best method:
This method is the best method in cases where the correlation is found by personal data.
7. This method is appropriate when number of elements is only 20 or 30.
Demerits:
Though the method is good but still there are certain drawbacks in it. They are as follows:
1. Unsuitable of grouped frequency distribution:
This method cannot be used for finding out correlation in grouped frequency distribution. This method is applicable only in individual observation.
2. Unsuitable if the values of the series exceed 30:
In such cases, obtaining ranks their difference and square becomes difficult so Pearsonian coefficient of correlation method is recommended. When N becomes more than thirty the counting becomes complicated. The scope of this method is limited.
3. Lack in precision:
This method is based on ranks. All the information related to data is not used, so it lacks precision as compared to Pearsonian method of coefficient of correlation.
![]()
Question 15.
The monthly expenditure of some families in a village are as follows:
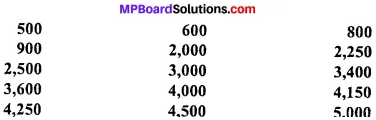
Calculate range and its coefficient?
Answer:
Range = H – L
= 5,000 – 500 = 4,500 Rs.
Coefficient of range = \(\frac{H – L}{H + L}\) = \(\frac{5000 – 500}{5000 + 500}\) =\(\frac { 4500 }{ 5500 }\) = 0.82
Question 16.
Two factories A and B are established in one industry? Following information are available about them:
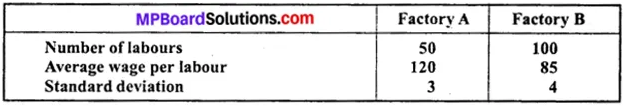
In which of factory wages rates are more?
Answer:
To find out the difference in wage rates we will have to find out coefficient of variation.
Coefficient of variation = \(\frac{S D}{\bar{X}} \times 100\)
Coefficient of variation of factory A = \(\frac{3}{120}\) × 100 = 2.5 %
Coefficient of variation of factory B = \(\frac{4}{85}\) × 100 = 4.7 %
Wage rates of factory B is more.
Question 17.
Explain the importance of correlation in statistics?
Answer:
Some importance features about the correlation:
- The correlation of a sample is represented by the letter r.
- The range of possible values for a correlation is between – 1 to +1.
- A positive correlation indicates a positive linear association. The strength of the positive linear association increases as the correlation becomes closer to +1.
- A negative correlation indicates a negative linear association. The strength of the negative linear association increases as the correlation becomes closer to -1.
- A correlation of either +1 or -1 indicates a perfect linear relationship. This is hard to find with real data.
![]()
Question 18.
Explain the utility of index numbers?
Answer:
1. Index numbers help in framing suitable policies:
Index numbers provide various type of information on the basis of which various policies suitable to our economy are framed. On the basis of index number the insurance companies fix their premiums and banks fix their interest rates. Railways fixed their fare on this index only. It gives knowledge about the purchasing power, industrial and agricultural production about other countries.
2. Make the difficult facts easy:
By index number, sometimes we make some facts and events easy which is not possible by any other method. For example, measurement of trading activities is not possible by studying single fact. But by analysing the progress of industrial production, Banking and transportation the trading index can be found out. Many emotional facts take the concrete form with the help of index. Thus, they are made simple and easier for general people.
3. Comparative study is possible:
By index number comparative study is possible. This is because they express changes in relative form so it is not difficult to compare two things.
4. Indication towards future economic tendency:
Index number expresses not only the present conditions but on the basis of it we can find out the conclusions of the facts of future also. Thus, we reach to the present facts with the help of future inferences and thus we get the indication of future economic tendency.
![]()
Question 19.
Define base year? What are the guidelines to be observed while determining the base year?
Answer:
Base year is the period with respect to which change is measured. Following guidelines are to be observed while determining the base year:
- Base year should be a normal year i.e. it should be free form abnormalities like wars, earthquakes, floods, etc.
- Base year should not be too old.
- Base year should be clearly defined.
Question 20.
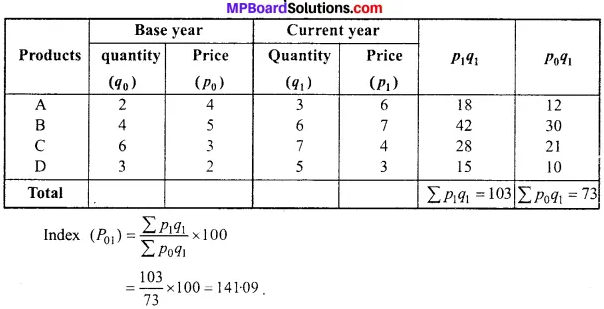
Construct price index for 1990 taking 1989 as base year from the following information:
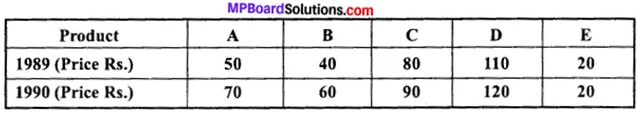
Answer:
Calculation of Price Index by simple aggregative method:
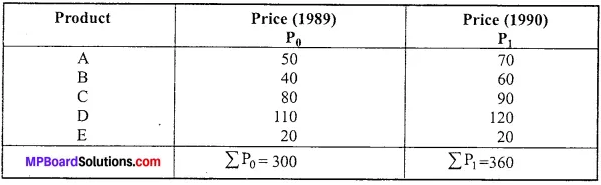
Price Index for year 1990 (P01) = \(\frac { \Sigma P_{ 1 } }{ \Sigma P_{ 0 } } \) x 100
= \(\frac{360}{300}\) x 100
= \(\frac{36000}{300}\) = 120
These is a net increase of (120 – 100) = 20% in prices in 1989 as compared to 1990.
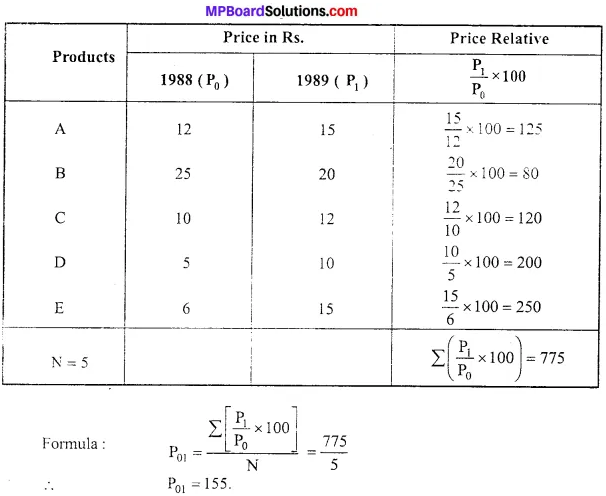
Question 21.
Calculate Index for 1989 taking base year 1989 by average of price relatives method?
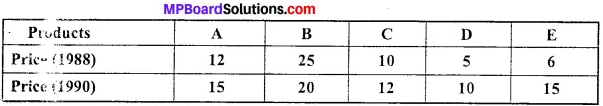
Answer:
Calculation of Price Index by average of price relatives method:
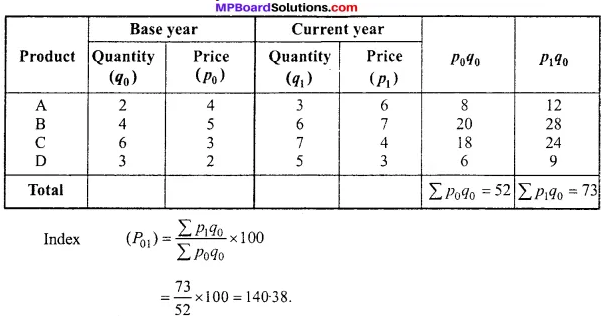
Question 22.
Calculation of Index by Laspeyre’s method from the following:
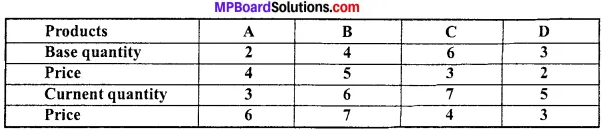
Answer:
Calculate of Index by Laspeyre’s method:
Question 23.
Calculate index by Paasche’s method the following:
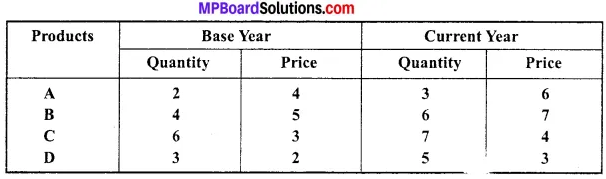
Answer:
Calculation of index by Paasche’s method:
Statistical Tools and Interpretation Long Answer Type Questions
Question 1.
If the arithmetic mean of the data given below is 28. Find:
- Missing frequency
- Median of the series.
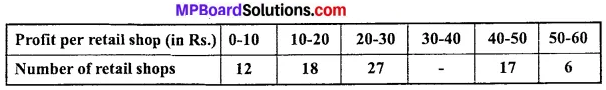
Answer:
Calculation of missing frequency:
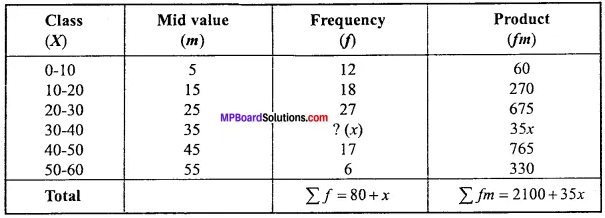
\(\overline { X } \) = \(\frac{Σfm}{Σf}\)
or 28 = \(\frac{2100+35x}{80+x}\)
or or 2240+ 28x = 2100 + 35x
or 2240 – 2100 = 35x – 28x
or 7x = 140
x = \(\frac{140}{7}\)
Hence, missing frequncy is 20.
Question 2.
Calculate median from the following:
Answer:
Calculation of median:
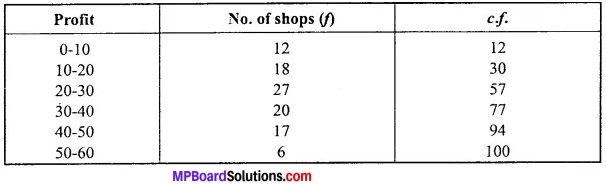
Median = Size of (\(\frac{N}{2}\))th items.
= \(\frac{100}{2}\)th item.
= 50th item.
50th median class is 20 – 30.
= 20 + \(\frac{20}{27}\) x 10 = 20 + 7.41 = 27.41
Question 3.
Calculate arithmetic mean by shortcut method:
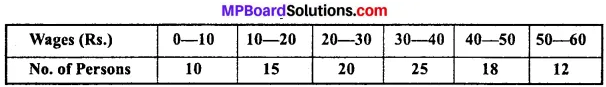
Answer:
Calculate of mean by shortcut method:
Formula: \(\overline { X } \) = A + \(\frac { \Sigma fdx }{ N } \)
Here, \(\overline { X } \) = ?, N = 100, A = 25, Σfdx = 620.
∴ \(\overline { X } \) = 25 + \(\frac{620}{100}\) = 25 + 6.2 = 31.2.
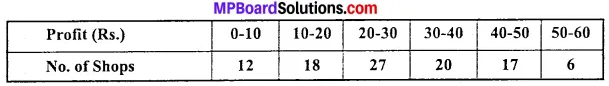
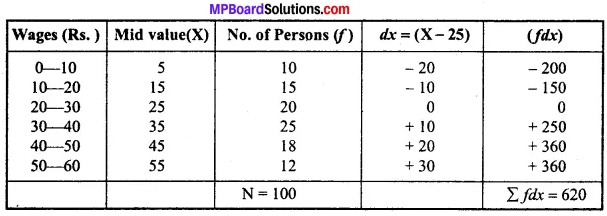
Question 4.
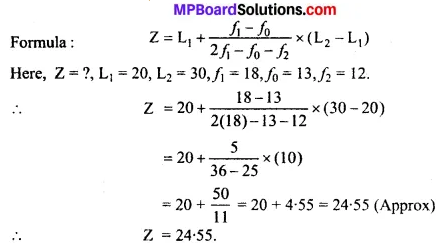
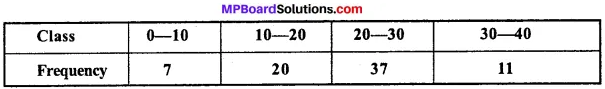
Calculate mode from the following data:
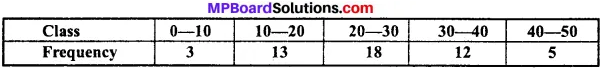
Answer:
From the following table modal class is 20 – 30 as its frequency is the highest.
Question 5.
Calculate quartiles from the followings:
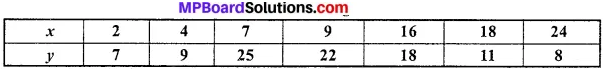
Answer:
Calculate of quartiles:
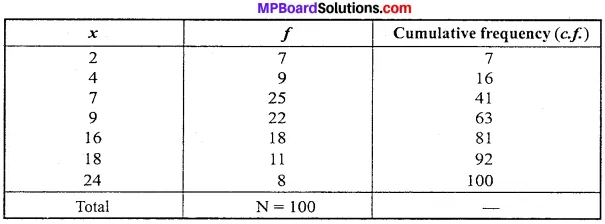
Q1 = \(\frac{N+1}{4}\) th item = \(\frac{100+1}{4}\) th item.
= 25.25 th item
= 25 th item + 0.25 (26 th item – 25 th item)
= 7 + 0.25 (7-7)
= 7 + 0.25(0) = 7 + 0 = 7.
Q2 = 2 (\(\frac{N+1}{4}\)) th item = 50.50 th item.
= 50 th item + 0.5 (51th item – 50th item)
= 9 + 0.5 (9 – 9) = 9 + 0.5(0) = 9 + 0 = 9.
Q3 = 3 (\(\frac{N+1}{4}\)) th item = 75.75 th item
75th item + 0.75 (76 th item – 75 th item)
= 16 + 0.75 (16 – 16)
= 16 + 0.75(0) = 16 + 0
= 16.
Question 6.
Calculate dispersion and relative measures of dispersion:

Answer:
Calculating relative measure of dispersion:
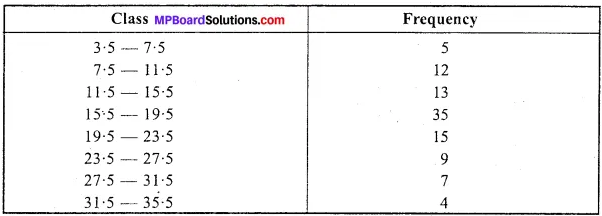
Here, R = ?, L = 35.5, S = 3.5.
Formula: R = L – S = 35.5 – 3.5 = 32
∴ Relative measure of dispersion = \(\frac{L-S}{L+S}\)
= \(\frac{35.5-3.5}{35.5+3.5}\)
= \(\frac{32}{39}\) = 0.8205 (Approx).
Question 7.
Calculate quartile deviation and its coefficient from the following data:
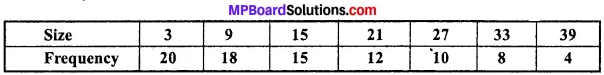
Answer:
Calculation of quartile deviation and its coefficient:
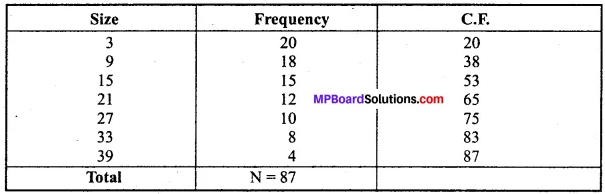
Q1 = Size of \(\frac{N+1}{4}\) th item = Size of \(\frac{87+1}{4}\) th item.
= Size of \(\frac{88}{4}\) th item.
= Size of 22 th item, which lies in C.F. 38
∴ Q1 =9
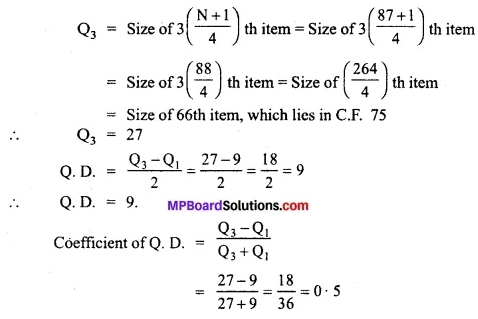
∴ Coefficient of Q.D. = 0.5.
Question 8.
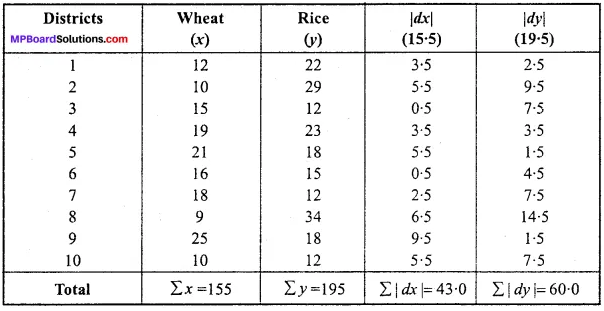
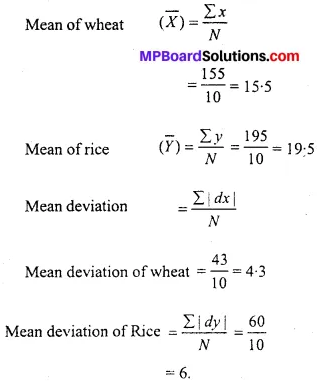
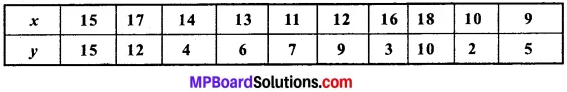
The yield of wheat and rice per acre for 10 districts of a state:
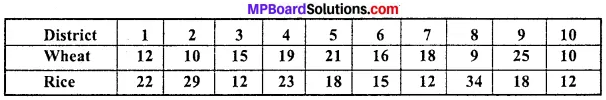
Calculate mean deviation about mean.
Answer:
Question 9.
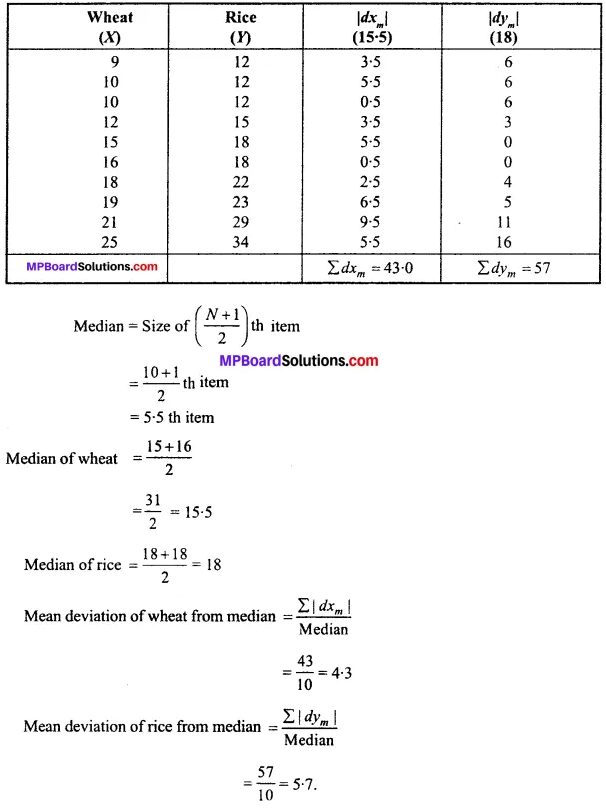
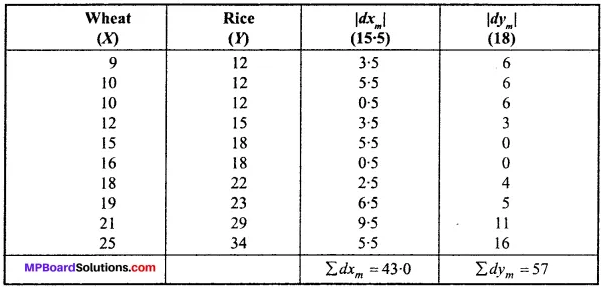
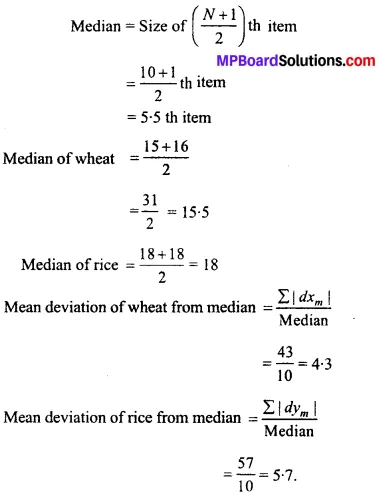
The yield of wheat and rice of 10 districts of a state are:
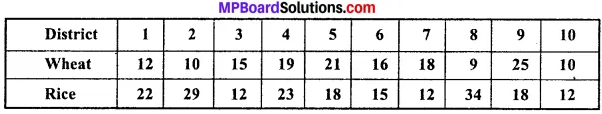
Calculate mean deviation from median.
Answer:
Question 10.
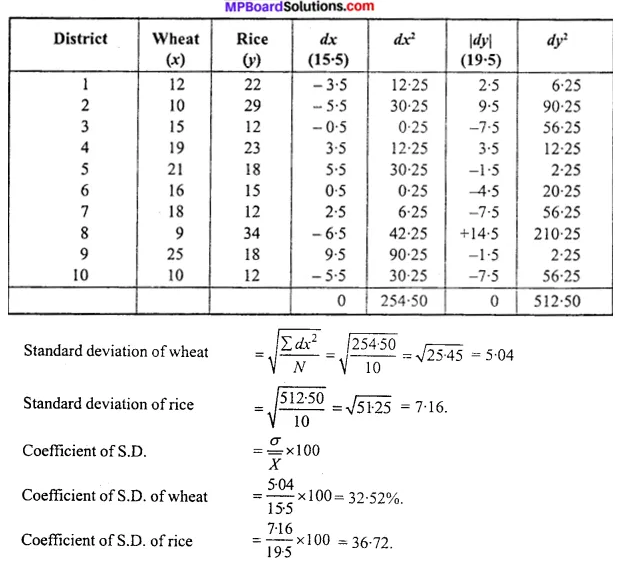
The yield of rice and wheat of 10 districts of a state are:
Calculate standard deviation and its coefficient?
Answer:
Question 11.
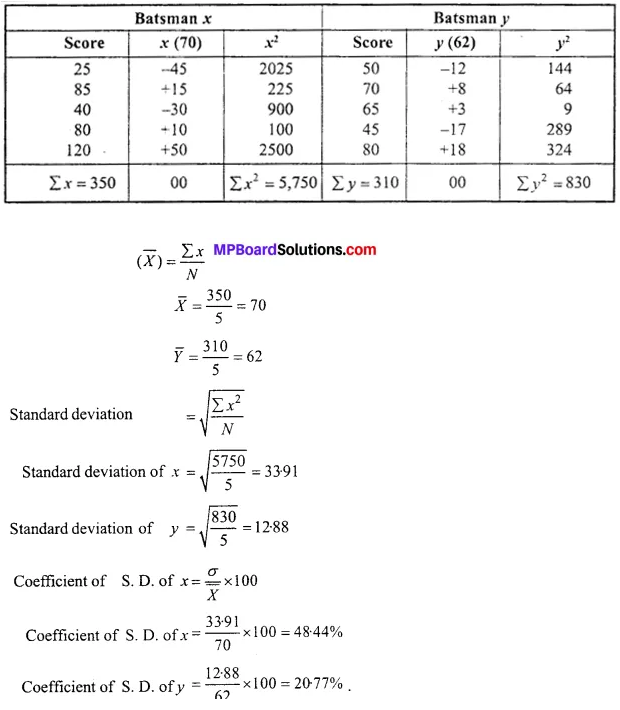
A batsman is to be selected for a cricket team? The choice is between X and Y on the basis of their scores in five previous scores which are:
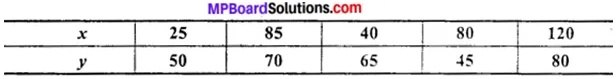
Which batsman should be selected if we want?
- A higher run gether or
- A more reliable batsman is the team
Answer:
Question 12.
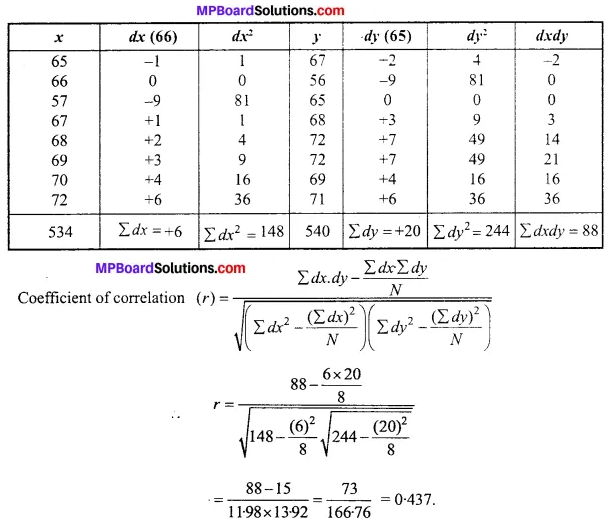
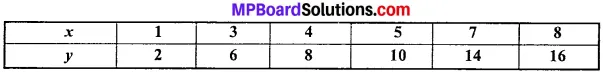
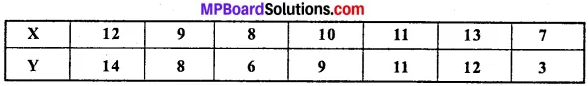
Calculate the correlation coefficient between the heights of fathers in inches (x) and their son (y):?
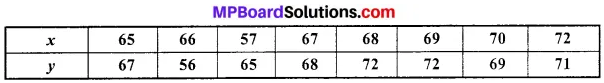
Answer:
Question 13.
Calculate coefficient of correlation between x and y, and comment on their relationship?
Answer:
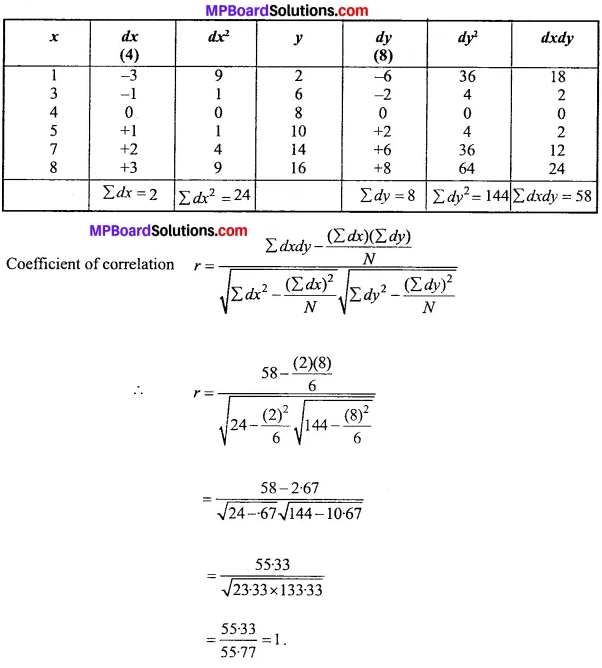
These are perfectly positive correlation between x and y.
Question 14.
There are 80 students in a class. Average marks of statistics in class is 65 marks. There are two sections in the class, first have 50 students whose average marks is 60. Calculate the average marks of other section?
Answer:
Total students N = 80
Average of marks \(\bar{X}_{1}\) = 65
Students of 1st section N1 = 50
Students of second section N2 = 80 – 50 = 30
Average marks of students of 1st section \(\bar{X}_{1}\) = 60
N \(\bar{X}_{1}\) = + N1 \(\overline { X } _{ 1 }\) + N2 \(\overline { X } _{ 2 }\)
80 x 65 = 50 x 60 + 30 \(\overline { X } _{ 2 }\)
5,200 – 3,000 = 30 \(\overline { X } _{ 2 }\)
30 \(\overline { X } _{ 2 }\) = 2,200
Average marks of students of 2nd section \(\overline { X } _{ 2 }\) = \(\frac { 1 }{ 2 }\)
\(\overline { X } _{ 2 }\) = 73.33.
Question 15.
Calculate mode from the following data:
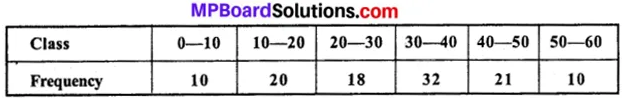
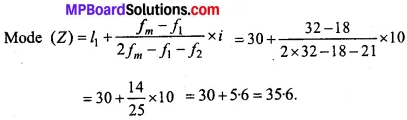
Answer:
Modal class is 30 – 40 as from observation highest frequency is 32?
Question 16.
The median in following table is 42? Determine the missing frequency?
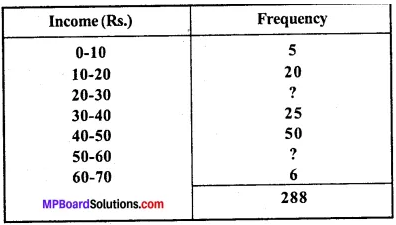
Answer:
Let the frequency of class 20 – 30 be f2 Unknown frequency of class 50 – 60 f2.
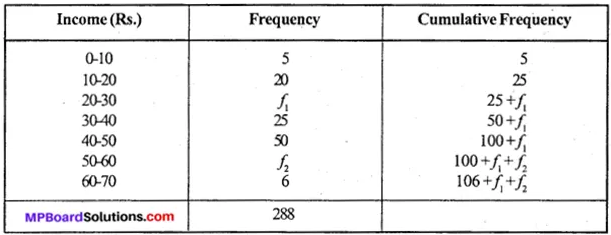
N = 288 = 106 + f1 + f2
160 + f1 + f2 = 288
f1 + f2 = 288
f1 + f2 = 288 – 106 = 182
Median 42 is in class 40 – 50.
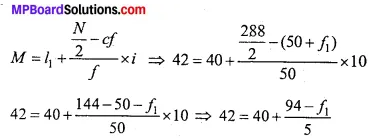
= 5 (42 – 40) = 94 – f1
= 210 – 200 = 94 – f1
= 10 – 94 = – f1
f1 = 84
f1 + f2 = 182
f2 = 182 – f1 = 182 – 84
f2 = 98
Question 17.
Compare the arithmetic mean, median and mode as measures of central tendency?
Answer:
Following table shows the comparison of arithmetic mean, median and mode as measures of central tendency:
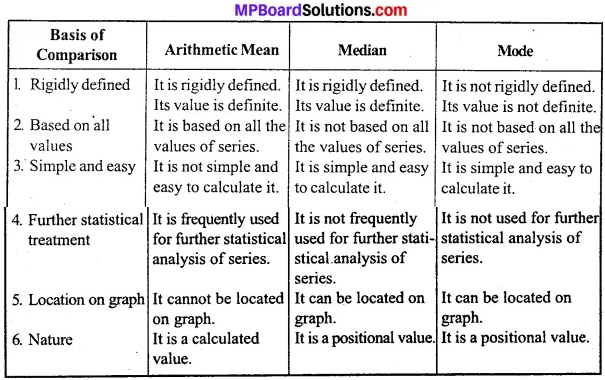
Question 18.
Distinguish between mean deviation and standard deviation?
Answer:
Following are differences between mean deviation and standard deviation:
- Algebraic sign like plus (+) and minus (-) are ignored while calculating mean deviation, they are taken into account in the calculation of standard deviation.
- Mean deviation can be calculated by any of the three averages i.e., mean, median and mode standard deviation can be calculated only by the Arithmetic mean.
- Mean deviation cannot be used for further algebraic treatment while standard deviation is capable of further algebraic treatment.
- Standard deviation is considered to be superior to mean deviation.
- Mean deviation is easy to calculated and to understand as compared to standard deviation.
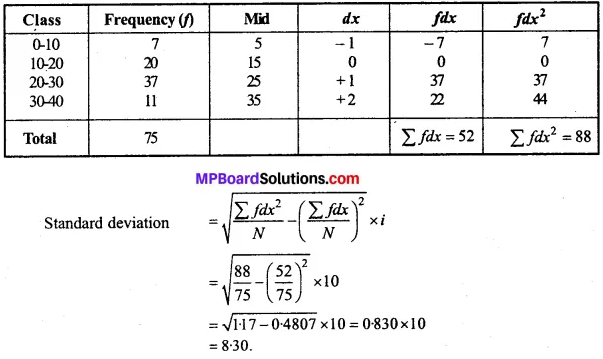
Question 19.
Calculate standard deviation from the following data:
Answer:
Question 20.
Calculate coefficient of correlation by Karl Pearson method from following data:
Answer:
Question 21.
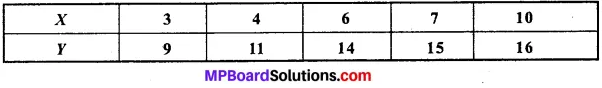
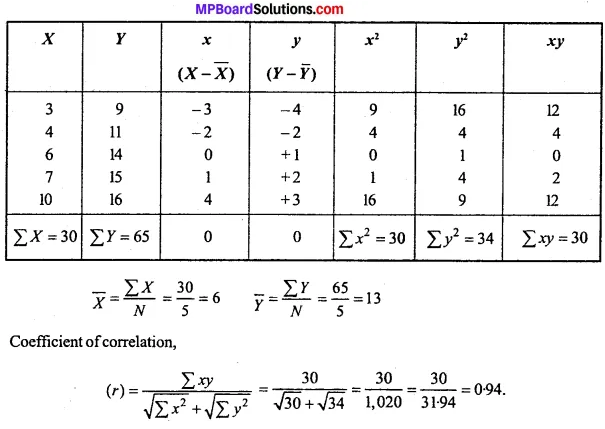
Calculate coefficient of correlation by Karl Pearson method from following data:
Answer:
Question 22.
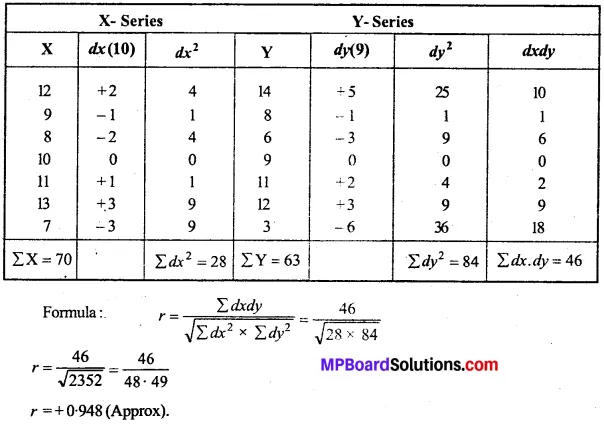
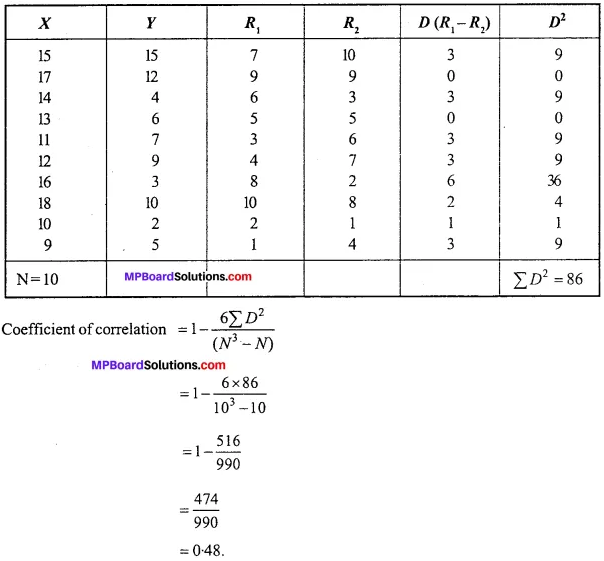
Calculate coefficient of correlation by Spearman rank difference method?
Answer:
Question 23.
In a drama competition two judges gave the following marks to 10 participants? Calculate rank coefficient?
Answer:
Question 24.
What is index number? What is its importance in statistics?
Answer:
An index number is a specialised average designed to measure the net change in a group of related variables over a period of time. Following are the main uses of index number which show its importance in statistics:
1. To simplify complicated matters:
Index numbers present the given information in such a manner that it can be easily understood.
2. To measure comparative changes:
Index numbers facilitate comparison of changes from time to time, among different places and in series expressed in different units. The changes in price level, cost of living etc. which are not capable to measurement directly are measured with the help of index numbers.
3. To frame suitable policies:
Index numbers guide a lot in framing suitable economic policies. For example, wholesale and retail price index number help in economic and business policy – making regarding, price, output, demand, sales etc. The indices of consumption of various commodities help in the planning of their future production. Index numbers are applied with advantage for formulating and revising their policies from time to time.
4. To measure the purchasing power of money:
Index numbers are helpful in measuring the purchasing power, i. e., value of the money. This helps in fixing proper wage policy in the country.
5. To study trends and to make forecast:
Index number are most widely used for measuring changes over a period of time. On the basis of present indices, the forecast for the future can be made.
![]()
Question 25.
What is the purpose of constructing an index number of price and quantities?
Answer:
The purpose of constructing and index number of prices is to enable us to compare prices of certain goods over a period of time. It is used to measure change in the price level or the value of money during different periods of time.
The purpose of constructing an index number of quantities is to enable us to compare physical quantity of goods produced, consumed or distributed over a period of time. It is used to show whether the level of agricultural and industrial production in the economy is increasing or decreasing.
Question 26.
What are the limitations of index number?
Answer:
The limitation of index numbers are as follows:
- Since index numbers are based on sample data, they only provide approximate results which may not exactly represent the changes in relative levels.
- There are more chances of errors in construction of index numbers. It may be any where from level of selection of commodities to choice of the formula.
- Index numbers often find difficulty to record change in the quality of a variable.
- There does not exist a unique index number method which is acceptable to all.
- Index numbers are also misused by dishonest persons to draw desirable conclusion for their selfish motives.
![]()
Question 27.
Throw light on importance of consumer price index?
Answer:
The importance of consumer price index is:
- It is used to determine the purchasing power of money and real wages.
- It is also used to analyze the market of specific commodities.
- It helps to formulate government policies.
- It helps in estimation of national income.
- Cost of living index numbers are used as basis for the wage adjustments.
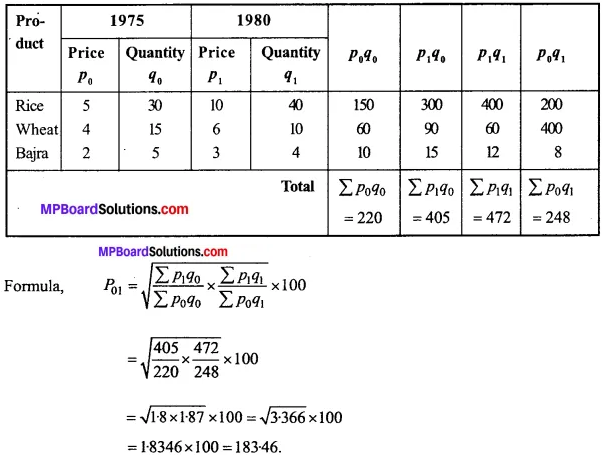
Question 28.
Calculate Price Index by Fisher’s method from following data:
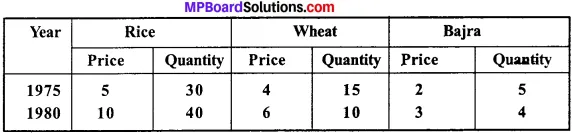
Answer:
Question 29.
What are the points to be kept in mind while constructing index number?
Answer:
The points to be kept in mind while constructing Index number are:
1. Purpose:
The purpose of construction of Index numbers should be clearly defined because every index number has a specific use.
2. Selection of a base years:
Selection of base year is important for construction of index number. It should be selected carefully.
3. Selection of number of Items:
It refers to collection of data which should be determined by the purpose for which the index is constructed.
4. Selection of an average:
As Index number are specialized averages. We need to decide on the average to be used. We need to select from various averages such as
arithematic mean, geometric mean, etc.
5. Selection system of weighing:
Weighing is having an important place in construction of index number. In this various goods are weighed according to their weights.