In this article, we will share MP Board Class 10th Social Science Book Solutions Chapter 5 Map Reading and Depiction Pdf, These solutions are solved subject experts from the latest edition books.
MP Board Class 10th Social Science Solutions Chapter 5 Map Reading and Depiction
MP Board Class 10th Social Science Text Book Exercise
Objective Type Questions
Map Reading And Depiction MP Board Class 10th Question 1.
Multiple Choice Questions:
(Choose the correct answer from the following)
Mp Board Class 10th Social Science Chapter 5 Question (a)
Publication of weather maps in India commenced from the year:
(a) 1853
(b) 1947
(c) 1950
(d) 1875.
Answer:
(d) 1875
Class 10 Social Science Chapter 5 MP Board Question (b)
In India maps are published in:
(a) Kolkata
(b) Delhi
(c) Pune
(d) Hyderabad.
Answer:
(c) Pune
Chapter 5 Social Science Class 10 MP Board Question (c)
The Meteorological Department in India is divided into:
(a) 6 zones
(b) 4 zones
(c) 5 zones
(d) 8 zones
Answer:
(c) 5 zones
Class 10th Social Science Chapter 5 MP Board Question 2.
Fill in the blanks:
- The international weather indicators (signs) were recognised in the year 1935 by the Meteorological Union/Federation at ……………….. (name the place).
- Beaufort was associated with ………………… Navy.
- Measurement of the speed of wind was for the first time planned in ………………………
Answer:
- Warsa
- British
- 1805.
Social Science Class 10 Chapter 5 MP Board Question 2.
Match the column:
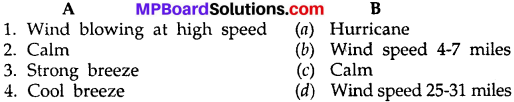
Answer:
- (a)
- (c)
- (d)
- (b)
MP Board Class 10th Social Science Very Short Answer Type Questions
Chapter 5 Class 10 Social Science MP Board Question 1.
What is Naut?
Answer:
Naut is the unit of measurement the speed of wind. 1 Naut = 1.85 km/hour.
Map Reading And Depiction Meaning In Hindi MP Board Class 10th Question 2.
How many centres of seismology are there in India?
Answer:
22 (Twenty-two).
MP Board Class 10th Social Science Short Answer Type Questions
Map Reading And Depiction In Hindi MP Board Class 10th Question 1.
What do you mean by weather signs?
Answer:
The signs or indications that indicate the condition of weather are called weather signs. With the help of figures or symbols in the map the weather of specific time or area is indicated.
Class 10th Mp Board Solution MP Board Question 2.
How is weather information collected for preparing weather map?
Answer:
Weather maps can be studied on the basis of following features:
- The weather features are indicated on the map through standard signs.
- For preparing weather maps information is obtained through observatories, pilots of aeroplanes, balloon, ships.
- Following information is collected in the observatories regarding the weather conditions:
- Temperature, rains, speed of winds the directions of wind, humidity, duration of sun light, conditions of the sea, previous and present weather condition etc.
Class 10 Social Science Mp Board Question 3.
How are weather conditions defected in weather map?
Answer:
The weather conditions defected in whether map through indicators accepted at the international level. These maps show the weather conditions of any area on earth, e.g., temperature, air pressure, rains, speed and direction of winds, condition of clouds, etc.
Class 10th Social Science Mp Board Question 4.
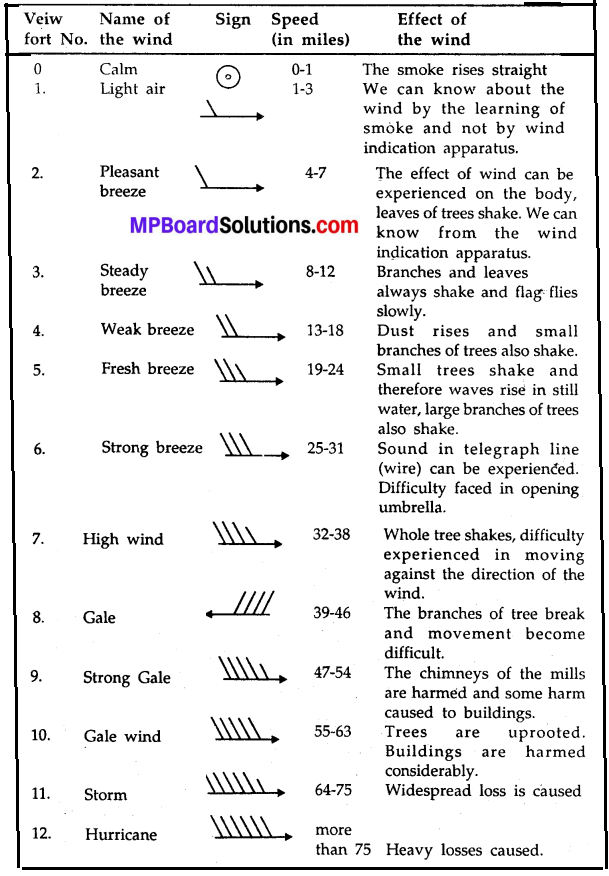
Identify the following wind measuring signs name them and write their speed?

Answer:
(i) Calm; speed 0 to 1 miles
(ii) Steady breeze; speed 8 to 12 miles
(iii) Fresh breeze; speed 19 to 24
(iv) Gale; speed 39 to 46 miles
(v) Storm; speed 64 to 75 miles.
Importance Of Weather Map MP Board Class 10th Question 5.
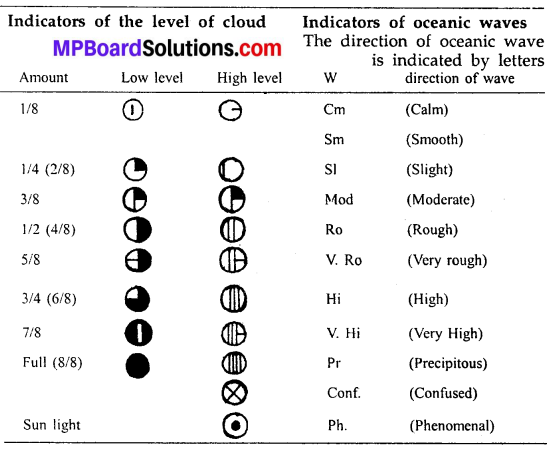
Identify the cloud condition and described their intensity and level?
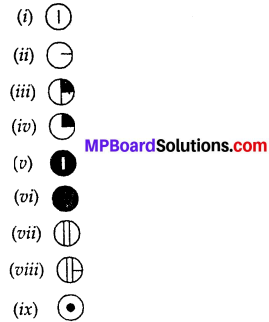
Answer:
(i) Low level; 1/8
(ii) High level; 1/8
(iii) Low level; 3/8
(iv) Low level; 2/8 or 1/4
(v) Low level; 7/8
(vi) Low level; full (8/8)
(vii) High level; 4/8 or 1/2
(viii) High level; 5/8
(ix) High level; Sunlight
Social Science Class 10 Mp Board Solutions Question 6.
Describe the atmosphere conditions on the basis of following isobar?
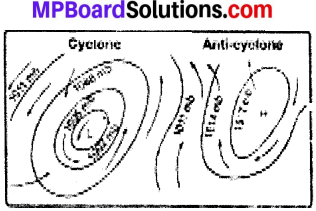
Answer:
- Is cyclone and
- Is anti – cyclone.
In cyclone when the isobars form concentric closed circles, the smallest circle in the center indicates a low pressure center. Air moves from a high pressure area to a low pressure area. In the Northern Hemisphere, the wind blows in a counter clock – wise direction in a cyclone. In the Southern Hemisphere, the wind blows in a clock – wise direction. These cyclones move in the direction of pressure center.
Air pressure in little in the center of shallow depression but it is very little in deep depression. Deep depression is surrounded by more than one isobar and shallow depression area is surrounded by single isobar and partially surrounded by other isobars. Isobars are depicted in a dispersed way in shallow depression and the isobars are shown close in depression. Under this condition the air mass rises above and takes the form of clouds and rains. Thus the weather conditions are rough in the cyclonic area.
The Anti – cyclone is opposite of cyclone. Anti – cyclone have high pressure in the center and they are surrounded by low pressure. The center of high pressure is called ‘Highs’. This is the point of intersection of two wedge lines. The isobar is usually circular, the winds blow in clock – wise direction in the Northern Hemisphere and counter clock – wise in the Southern Hemisphere.
The winds blow outwards from the center in such condition. Anti – cyclone are weak and stay at one place for quite some times. The wind is slow and keep varying. Anti – cyclone do not move in a definite direction and the center is calm. In the front the winds blow in a definite direction; the sun is bright and sky is clear and dry. Sometimes there are drizzling rains.
MP Board Class 10th Social Science Long Answer Type Questions
Mp Board Class 10th Social Science Solution Question 1.
Describe the importance of weather maps. Where we can use the information of weather forecast which in shown in weather map?
Answer:
Need and importance of the study of weather map:
With the help of weather maps it is possible to know in advance the weather conditions, these forecasts are published in news – papers and broadcasted through ’Akashvani’.
Through these forecasts efforts are made to provide safety and security to the people in times of natural calamities like excessive rains, (and consequently floods etc.) inadequate rains (and draught conditions as a consequence), earthquake, hailstorm, cyclones, snow fall, etc.
The forecasts made on the basis of weather map help in talking suitable safety measures at the time of navigation safe aeroplanes, flights, and drought conditions and their ill effects and properly carrying out the agricultural operations.
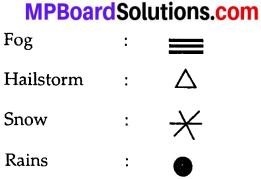
Question 2.
Draw symbol/signs to show the following weather conditions:
Fog, Hailstorm, Snow, Rains?
Or
Give the indication of the following seasonal conditions:
1. Snow
2. Rains
3. Fog
4. Hailstorm (MP Board 2009)
Give the indication of weather in your answer book:
1. Fog
2. Hailstrom
3. Rain
Answer:
Question 3.
Explain following points in the given weather map Cyclone and Anti – cyclone, Wedge?
Answer:
Do with help of your subject teacher.
MP Board Class 10th Social Science Additional Important Questions
Objective Type Questions
Question 1.
Multiple Choice Questions.
(Choose the correct answer from the following)
Question (a)
The Meteorological Department in India was set up in the year of:
(a) 1854
(b) 1864
(c) 1874
(d) 1884.
Answer:
(b) 1864
Question (b)
The meteorological department has set up 22 centers for measuring the intensity of:
(a) Natural calamity
(b) Earthquake
(c) Landslide
(d) Flood.
Answer:
(b) Earthquake
Question (c)
Blowing sudden heavy winds?
(a) Wind
(b) Storm
(c) Cyclone
(d) Breeze.
Answer:
(b) Storm
Question (d)
On the basis of temperature, India is divided into:
(a) Two parts
(b) Three parts
(c) Four parts
(d) Five parts.
Answer:
(d) Five parts.
Question 2.
Fill in the blanks:
- The weather features are indicated on the map through standard ………………………..
- ………………….. is the center of publication for weather map.
- The weather informations are collected through ……………………….
- Sometimes low pressure is indicated by …………………….
Answer:
- signs
- Pune
- observatories
- L.
Question 3.
True and False Type Questions:
- High Pressure is normally indicated by P.
- There are 1142 observatories in India.
- The meteorological department was set up by the British Govt, in the state of Bengal.
- The universal symbols of weather conditions were accepted in the International Meteorological conference held in Warsa in the year 1935.
- In Kashmir the direction of winds are from north to south.
Answer:
- False
- True
- True
- True
- True.
Answer in One – Two Words or One Sentence
Question 1.
How many regions have been divided in India by meteorological department?
Answer:
Five.
Question 2.
Where is the head office of meteorological department in India located?
Answer:
Delhi.
Question 3.
Name the place of other offices of meteorological department in India?
Answer:
Nagpur, Mumbai, Chennai and Kolkata.
Question 4.
How many centers are there for measuring the intensity of earthquake in India?
Answer:
22 centers.
Question 5.
Who developed the indicator of air speed?
Answer:
Vufort.
Question 6.
What is V – shaped depression?
Answer:
When the isobars on the surface are V – shaped, it is called V – shaped depression.
MP Board Class 10th Social Science Very Short Answer Type Questions
Question 1.
In which area the pressure of air pressure was normal?
Answer:
The mountain region of North Bihar, Andaman and Nicobar and Eastern Myanmar, the air pressure was normal.
Question 2.
What is mean by weather map?
Answer:
The map in which we study the condition of temperature, speed of wind, humidity, duration of sunlight etc. is called weather map.
Question 3.
Where are the weather forecasts most useful which are obtained from weather map?
Answer:
Weather forecast are most useful to the certain places at the time of nature calamities, inadequate rain, earthquake and cyclone etc.
Question 4.
Which are the main points to be interpreted in weather map?
Answer:
The following points are the main to interpret in weather map:
- Variation in temperature
- Variation in air pressure
- Rainfall
- Clouds.
Question 5.
How cyclone and anti – cyclone are formed?
Answer:
Cyclone and anti – cyclone are formed due to the contact of two different types of wind. The contact point is known as a surface of separation.
Question 6.
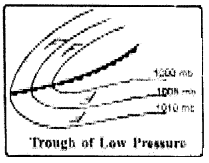
What do you mean by wedge? Also, define crest line?
Answer:
Wedge is a triangular high pressure area. The isobars are V – shaped with rounded peak. The peak indicates towards the low pressure area. In the center of the edge, the air pressure is the highest and it goes on diminishing towards the peak and edge. The line joining the highest pressure point and the peak point it called crest line.
MP Board Class 10th Social Science Short Answer Type Questions
Question 1.
What do you mean by international climatic indicators?
Answer:
The facts and information received from observatories are indicated in the map with the help of figures, signs and symbols which are accepted internationally. These are called international climate indicators. These were given recognition in the International Meteorological meet (conference) held in Warsa (Italy) in the year 1935.
Question 2.
What do you mean by the indicator of air speed?
Answer:
Indicators of air speed:
The system of measuring the wind speed was pioneered by the British naval chief Vufort in 1805, that system is being used even today with some modifications. In the Indian Weather maps. Wind indicator which are being used are different from the one developed by Vufort.

This wind indicator shows the speed through its rear wings and the front end indicates the direction. Through these wings any speed can be indicated. Normally by changing half of the wind a difference of five knots occurs.
Question 3.
What are the need and importance of the study of, weather map?
Answer:
Need and importance of the study of weather map:
1. With the help of weather maps it is possible to know in advance the weather conditions, these forecasts are published in news papers and broadcasted though ‘Akashvani’. Through these forecasts efforts are made to provide safety and security to the people in times of natural calamities like excessive rains, (and consequently floods etc.), inadequate rains (and draught conditions as a consequence) earthquake, hailstorm, cyclones, snow fall etc.
2. The forecasts made on the basis of weather map help in taking suitable safety measures at the time of navigation safe aeroplanes, flights, and drought conditions and their ill effects and properly carrying gout the agricultural operations.
MP Board Class 10th Social Science Long Answer Type Questions
Question 1.
Write a short note on Meteorological Department of India?
Answer:
1. The Meteorological Department in India was set up in the year 1864 in Bengal on the recommendation of the Asiatic Society. In the beginning its office was in Shimla. After the Second World War the head office and observatory was set up in Delhi.
2. This department, does the work of studying changes in the weather conditions in various parts of the country on daily basis, observation, documentation, collection of data and observation of weather conditions of neighbouring countries, their analysis and forecasting in advance.
3. The meteorological department in India has been divided into five regions. The head office is in Delhi. Nagpur, Mumbai, Chennai and Kolkata or other offices. There are 1142 observatories, 2500 rain gauges and 22 centers for measuring the intensity of earthquake, in India.
Question 2.
Explain with the help of diagram the main sign of clouds?
Answer:
The shadow in circle is indicated to cloud. In the Indian maps clouds with only low and medium height are shown.The level of clouds is shown by different types of circles. In India only low and medium hight clouds are shown. The percentage of cloud is indicated on the 8th part of the circle.
Question 3.
Outline the different sign of measuring wind speed?
Or
Give the Indication of air measurement of the following:
- light air
- Calm
- Gale
- Fresh Breeze
- Strong Breeze (MP Board 2009)
Or
Give the indication of plesant breeze weather in your answer – book? (MP Board 2009)
Or
Give the indications of fresh breeze and gale weather in your answer – book? (MP Board 2009)
Answer:
Signs to measure speed of the wind
Question 4.
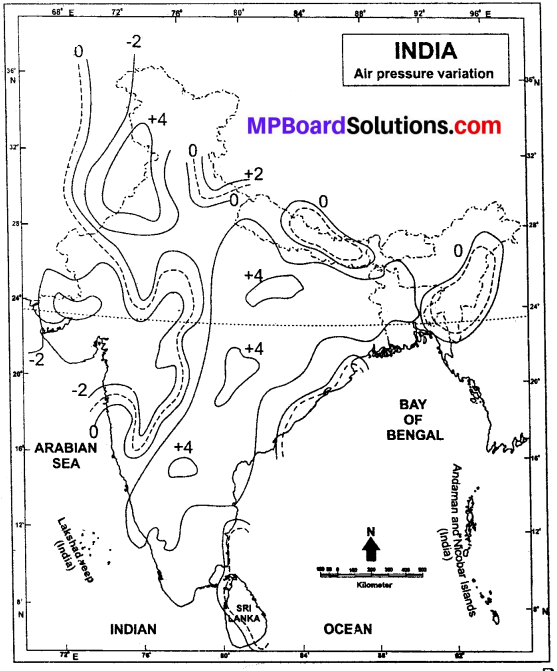
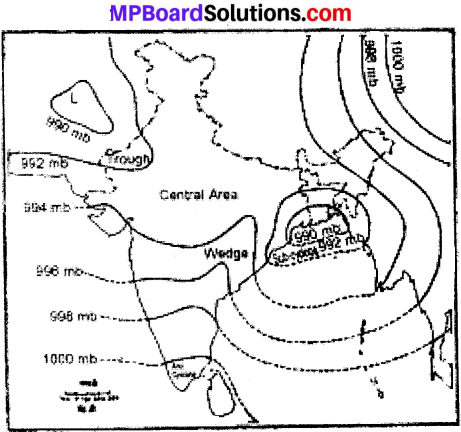
Explain the variation of air pressure with the help of Indian map and draw the conclusion related to the trends?
Answer:
Variation in air pressure:
In the weather map the air pressure is shown with the help of millibar. This is normally indicated by the difference between two millibars. The higher number shows high air pressure and the lower number shows low air pressure.
Sometimes low pressure is indicated by writing L and high pressure by H. This is read like contour lines. The air always blows towards low pressure area from the high pressure area.
1. Normal distribution of air pressure:
High and low pressure zone.
2. Speed of cyclones:
With the help of the air pressure map, we can explain the conditions of air pressure in the atmosphere. From the map given we see that the air pressure was 2 millibar less than the normal. Only in two zones the pressure was normal. The mountain region of North, Bihar, Andaman and Nicobar and Eastern Myanmar the air pressure was normal.