MP Board Class 7th Maths Solutions Chapter 3 Data Handling Ex 3.1
Question 1.
Find the range of heights of any ten students of your class.
Solution:
Let the heights (in cm) of 10 students of our class be 125, 129, 131, 132, 134, 136, 139, 142, 144, 146
Highest observation = 146 cm
Lowest observation =125 cm
Range = Highest observation – Lowest observation
= (146 – 125) cm = 21 cm
Question 2.
Organise the following marks in a class assessment, in a tabular form. 4, 6, 7, 5, 3, 5, 4, 5, 2, 6, 2, 5, 1, 9, 6, 5, 8, 4, 6, 7
Solution:
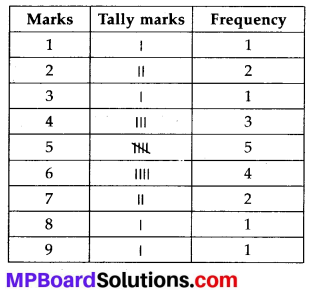
(i) Highest number = 9
(ii) Lowest number = 1
(iii) Range = (9 – 1) = 8
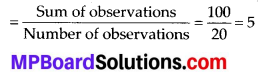
(iv) Sum of all the observations =4 + 6 + 7 + 5 + 3 + 5 + 4 + 5 + 2 + 6 + 2 + 5 + 1 + 9 + 6 + 5 + 8 + 4 + 6 + 7 = 100
Total number of observations = 20
Arithmetic mean
Question 3.
Find the mean of the first five whole numbers.
Solution:
First five whole numbers are 0, 1, 2, 3 and 4.
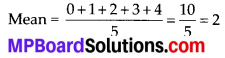
Hence, the mean of first five whole numbers is 2.
Question 4.
A cricketer scores the following runs in eight innings: 58, 76,40, 35,46,45,0,100.
Find the mean score.
Solution:
Runs scored by the cricketer in eight innings are 58, 76, 40, 35, 46, 45, 0 and 100.
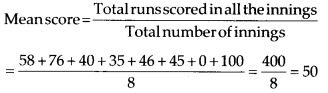
Therefore, mean score is 50.
![]()
Question 5.
Following table shows the points of each player scored in four games:
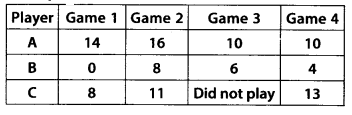
Now answer the following questions:
(i) Find the mean to determine A’s average number of points scored per game.
(ii) To find the mean number of points per game for C, would you divide the total points by 3 or by 4? Why?
(iii) B played in all the four games. How would you find the mean?
(iv) Who is the best performer?
Solution:
(i) A’s average number of points
![]()
(ii) To find the mean number of points per game for C, we will divide the total points by 3 because C played 3 games.
![]()
(iii) Mean of B’s Score
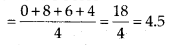
(iv) The best performer will have the greatest average among all. Now we can observe that the average of A is 12.5 which is more than that of B and C. Therefore, A is the best performer.
![]()
Question 6.
The marks (out of 100) obtained by a group of students in a Science test are 85, 76, 90, 85, 39, 48, 56, 95, 81 and 75. Find the:
(i) Highest and the lowest marks obtained by the students.
(ii) Range of the marks obtained.
(iii) Mean marks obtained by the group.
Solution:
The marks obtained by the group of students in a Science test can be arranged in ascending order as follows.
39, 48, 56, 75, 76, 81, 85, 85, 90, 95
(i) Highest marks = 95 Lowest marks = 39
(ii) Range = 95 – 39 = 56
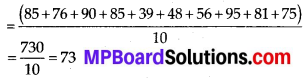
(iii) Mean marks
Question 7.
The enrolment in a school during six consecutive years was as follows:
1555, 1670, 1750, 2013, 2540, 2820
Find the mean enrolment of the school for this period.
Solution:
Mean enrolment
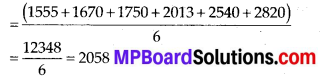
![]()
Question 8.
The rainfall (in mm) in a city on 7 days of a certain week was recorded as follows:
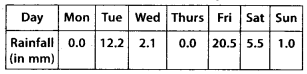
(i) Find the range of the rainfall in the above data.
(ii) Find the mean rainfall for the week.
(iii) On how many days was the rainfall less than the mean rainfall?
Solution:
(i) Range = (20.5 – 0.0) mm = 20.5 mm
(ii) Mean rainfall
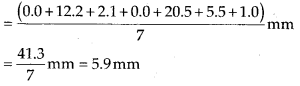
(iii) For 5 days (i.e., Monday, Wednesday, Thursday, Saturday, Sunday), the rainfall was less than the mean rainfall.
Question 9.
The heights of 10 girls were measured in cm and the results are as follows:
135, 150, 139, 128, 151, 132, 146, 149, 143, 141.
(i) What is the height of the tallest girl?
(ii) What is the height of the shortest girl?
(iii) What is the range of the data?
(iv) What is the mean height of the girls?
(v) How many girls have heights more than the mean height?
Solution:
Arranging the heights of 10 girls in an ascending order;
128, 132, 135, 139, 141, 143, 146, 149, 150, 151
(i) Height of the tallest girl = 151 cm
(ii) Height of the shortest girl = 128 cm
(iii) Range = (151 – 128) cm = 23 cm
(iv) Mean height
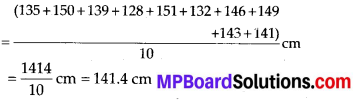
(v) The heights of 5 girls are greater than the mean height (i.e., 141.4 cm) and these heights are 143 cm, 146 cm, 149 cm, 150 cm and 151 cm.
![]()