MP Board Class 8th Maths Solutions Chapter 5 Data Handling Ex 5.2
Question 1.
A survey was made to find the type of music that a certain group of young people liked in a city. Adjoining pie chart shows the finding of this survey.
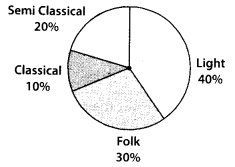
From this pie chart answer the following :
(i) If 20 people liked classical music, how many young people were surveyed?
(ii) Which type of music is liked by the maximum number of people?
(iii) If a cassette company were to make 1000 CD’s, how many of each type would they make?
Solution:
(i) Let total number of young people were surveyed be x.
According to question, \(x \times \frac{10}{100}\) = 20
![]()
Thus, 200 young people were surveyed.
(ii) Pie chart shows that the maximum number of people like light music.
(iii) Cassette company has to make 1000 CD’s.
∴ Number of CD’s of semi classical music
![]()
Number of CD’s of classical music
![]()
Number of CD’s of folk music
![]()
Number of CD’s of light music 40
![]()
![]()
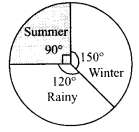
Question 2.
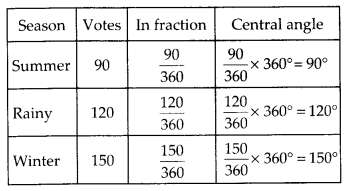
A group of 360 people were asked to vote for their favourite season from the three seasons
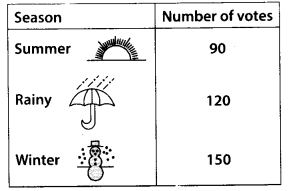
(i) Which season got the most votes?
(ii) Find the central angle of each sector.
(iii) Draw a pie chart to show this information.
Solution:
(i) Winter season got the most votes,
(ii) Total number of votes = 90 + 120 + 150
= 360
Total angle at the centre of a circle = 360°
(iii) Now, we have to draw a pie chart to show the given information :
![]()
Question 3.
Draw a pie chart showing the following information. The table shows the colours preferred by a group of people.
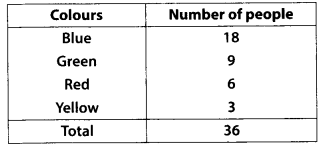
Find the proportion of each sector. For example,
Blue is \(\frac{18}{36}=\frac{1}{2}\) ; Green is \(\frac{9}{36}=\frac{1}{4}\) and so on. Use this to find the corresponding angles.
Solution:
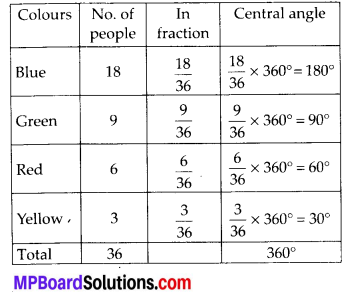
We have to draw a pie chart showing a given information :

![]()
Question 4.
The given pie chart gives the marks scored in an examination by a student in Hindi, English, Mathematics, Social Science and Science. If the total marks obtained by the students were 540, answer the following questions.
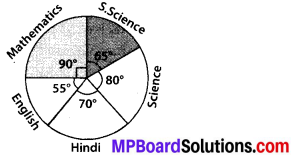
(i) In which subject did the student score 105 marks?
(Hint: For 540 marks, the central angle = 360°. So, for 105 marks, what is the central angle?)
(ii) How many more marks were obtained by the student in Mathematics than in Hindi?
(iii) Examine whether the sum of the marks obtained in Social Science and Mathematics is more than that in Science and Hindi. (Hint: Just study the central angles)
Solution:
(i) Total marks scored by students = 540
Central Angle
![]()
Since central angle is 70°, thus we found that in Hindi, the student scored 105 marks.
(ii) Marks scored in Mathematics
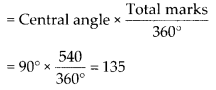
Thus, marks obtained by the student in Mathematics more than in Hindi = 135 – 105 = 30
(iii) Marks obtained in Social Science
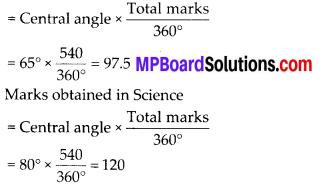
So, marks obtained in Social Science and Mathematics = 97.5 + 135
= 232.5 …(i)
And marks obtained in Science and Hindi = 120+ 105 = 225 …(ii)
Thus, (i) and (ii) shows that marks obtained in Mathematics and Social Science is more than that in Science and Hindi.
![]()
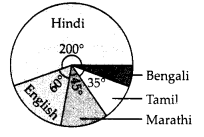
Question 5.
The number of students in a hostel, speaking different languages is given below. Display the data in a pie chart.
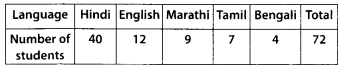
Solution:
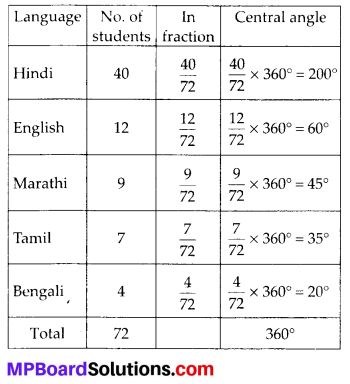
The pie chart is shown below :