In this article, we will share MP Board Class 10th Maths Book Solutions Chapter 14 Statistics Ex 14.2 Pdf, These solutions are solved subject experts from the latest edition books.
MP Board Class 10th Maths Solutions Chapter 14 Statistics Ex 14.2
Question 1.
The following table shows the ages of the patients admitted in a hospital during a year:
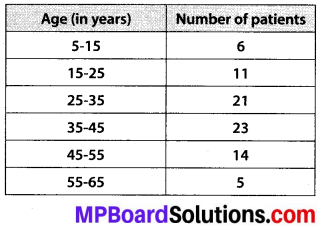
Find the mode and the mean of the data given above. Compare and interpret the two measures of central tendency.
Solution:
Mode:
Here, the highest frequency is 23.
The frequency 23 corresponds to the class interval 35 – 45.
∴ The modal class is 35 – 45
Now, class size, h = 10
Lower limit, l = 35
Frequency of the modal class (f1) = 23
Frequency of the class preceding the modal class (f0) = 21
Frequency of the class succeeding the modal class (f2) = 14
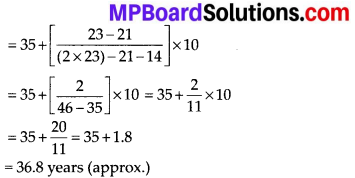
∴ Mode = l + \(\left[\frac{f_{1}-f_{0}}{2 f_{1}-f_{0}-f_{2}}\right]\) × h
Mean: Let assumed mean, a = 40
Class size, h = 10
∴ ui = \(\frac{x_{i}-a}{h}=\frac{x_{i}-40}{10}\)
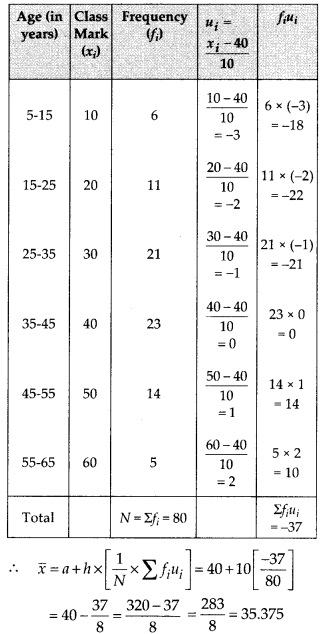
∴ Required mean = 35.38 years.
Interpretation:
The maximum number of patients admitted in the hospital are of age 36.8 years while the average age of patients is 35.37 years.
![]()
Question 2.
The following data gives the information on the observed lifetimes (in hours) of 225 electrical components:
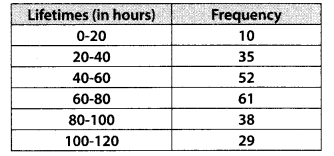
Determine the modal lifetimes of the components.
Solution:
Here, the highest frequency = 61.
∵ The frequency 61 corresponds to class 60 – 80
∴ The modal class is 60 – 80
∴ We have l = 60, h = 20, f1 = 61, f0 = 52, f2 = 38
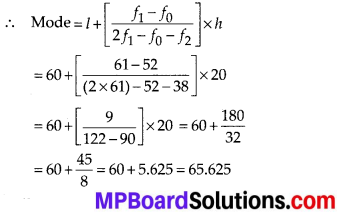
Thus, the modal lifetimes of the components is 65.625 hours.
Question 3.
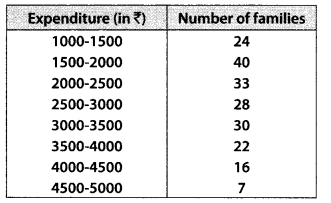
The following data gives the distribution of total monthly household expenditure of 200 families of a village. Find the modal monthly expenditure of the families. Also, find the mean monthly expenditure:
Solution:
Mode:
∵ The maximum number of families i.e., 40 have their total monthly expenditure is in interval 1500 – 2000.
∴ The modal class is 1500 – 2000 and l = 1500, h = 500, f1 = 40, f0 = 24, f2 = 33
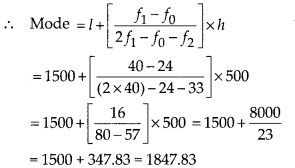
Thus, the required modal monthly expenditure of the families is ₹ 1847.83.
Mean: Let assumed mean, a = 3250
and class size, h = 500
∴ ui = \(\frac{x_{i}-a}{h}=\frac{x_{i}-3250}{500}\)
∴ We have the following table;
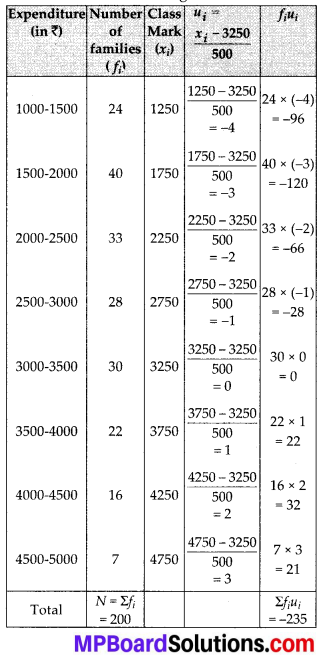
∴ \(\overline{x}\) = a + h × [\(\frac{1}{N}\) Σfiui] = 3250 + 500 × \(\left[\frac{-235}{200}\right]\)
= 3250 – \(\frac{1175}{2}\) = 3250 – 587.50 = 2662.5
Thus, the mean monthly expenditure = ₹ 2662.50
Question 4.
The following distribution gives the state-wise teacher-student ratio in higher secondary schools of India. Find the mode and mean of this data. Interpret the two measures.
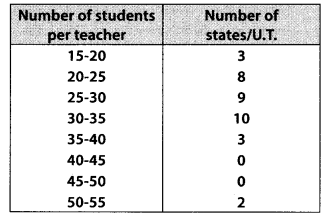
Solution:
Mode : Since greatest frequency i.e., 10 corresponds to class 30 – 35.
∴ Modal class = 30 – 35 and h = 5, l = 30, f1 = 10, f0 = 9, f2 = 3
∴ Mode = l + \(\left[\frac{f_{1}-f_{0}}{2 f_{1}-f_{0}-f_{2}}\right]\) × h
= 30 + \(\left[\frac{10-9}{20-9-3}\right]\) × 5
= 30 + \(\left[\frac{10-9}{20-9-3}\right]\) × 5 = 30 + 0.625 = 30.6 (approx)
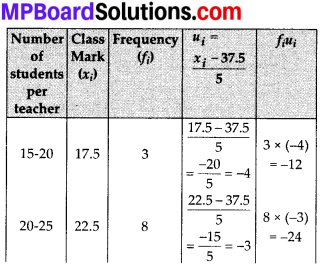
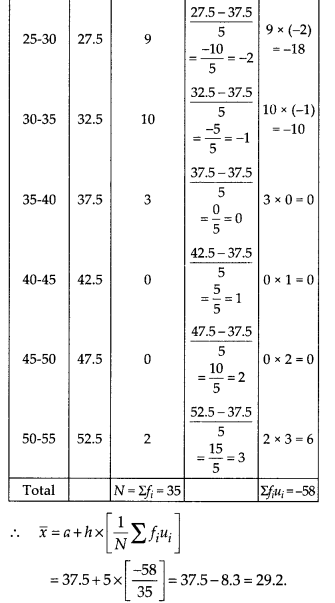
Mean: Let the assumed mean, a = 37.5 and class size, h = 5
∴ ui = \(\frac{x_{i}-a}{h}=\frac{x_{i}-37.5}{5}\)
∴ We have the following table:
Interpretation:
The maximum teacher-student ratio is 30.6 while average teacher-student ratio is 29.2
![]()
Question 5.
The given distribution shows the number of runs scored by some top batsmen of the world in one-day international cricket matches.
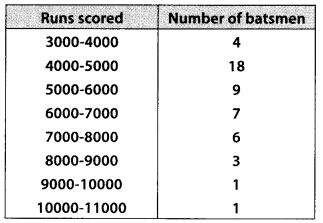
Find the mode of the data
Solution:
∵ The class 4000 – 5000 has the highest frequency i.e., 18
∴ Modal class = 4000 – 5000.
Also, h = 1000, l = 4000, f1 = 18, f0 = 4, f2 = 9
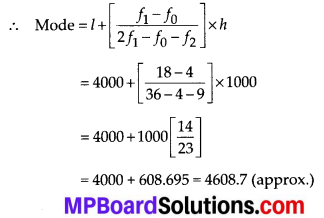
Thus, the required mode is 4608.7 runs.
Question 6.
A student noted the number of cars passing through a spot on a road for 100 periods each of 3 minutes and summarised it in the table given below. Find the mode of the data:
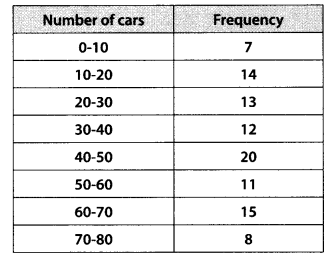
Solution:
∵ The class 40 – 50 has the maximum frequency i.e., 20
∴ Modal class = 40 – 50
∴ f1 = 20, f0 = 12, f1 = 11 and l = 40. Also, h = 10
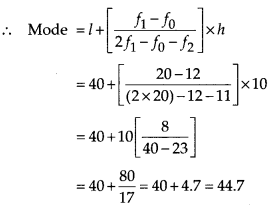
Thus, the required mode is 44.7 cars.